You know the moment. A vehicle looks clean on the forecourt, the basic history check comes back quiet, and the buying decision feels straightforward. Then, after the handover or a later file review, a mileage inconsistency, a short keeper pattern, or an event buried in the timeline starts to change the picture. That gap between a pass/fail check and a real provenance view is where trade margin gets exposed.
Table of Contents
- Why a Single Snapshot Is Not Enough on the Trade Forecourt
- What Historical Trend Analysis Means in Vehicle Provenance
- Direction matters more than isolated records
- What the method is, and what it is not
- UK Data Sources That Feed a Provenance Timeline
- What each source actually contributes
- UK Data Sources That Feed a Provenance Timeline
- Methods That Turn Records into Risk Signals
- Four methods that change the buying decision
- KPIs and Risk Signals Dealers Should Actually Monitor
- The measures worth watching
- How to use the signals without over-reading them
- Two Trade Examples That Show the Difference
- What changed between the two decisions
- A Practical Workflow for Trade Stock Acquisition
- A simple handoff that fits a buying desk
- Best Practices, Pitfalls and How AutoProv Fits In
Why a Single Snapshot Is Not Enough on the Trade Forecourt
A clean-looking car can still carry a messy history. A wholesaler may see a tidy record, a plausible mileage reading, and no obvious red flags, then miss the part of the timeline that really matters, such as a sudden jump in usage, a keeper pattern that turns over too quickly, or an insurance-related event that only becomes visible when records are lined up over time. That is the problem with treating vehicle history check UK output as if it were the whole story.
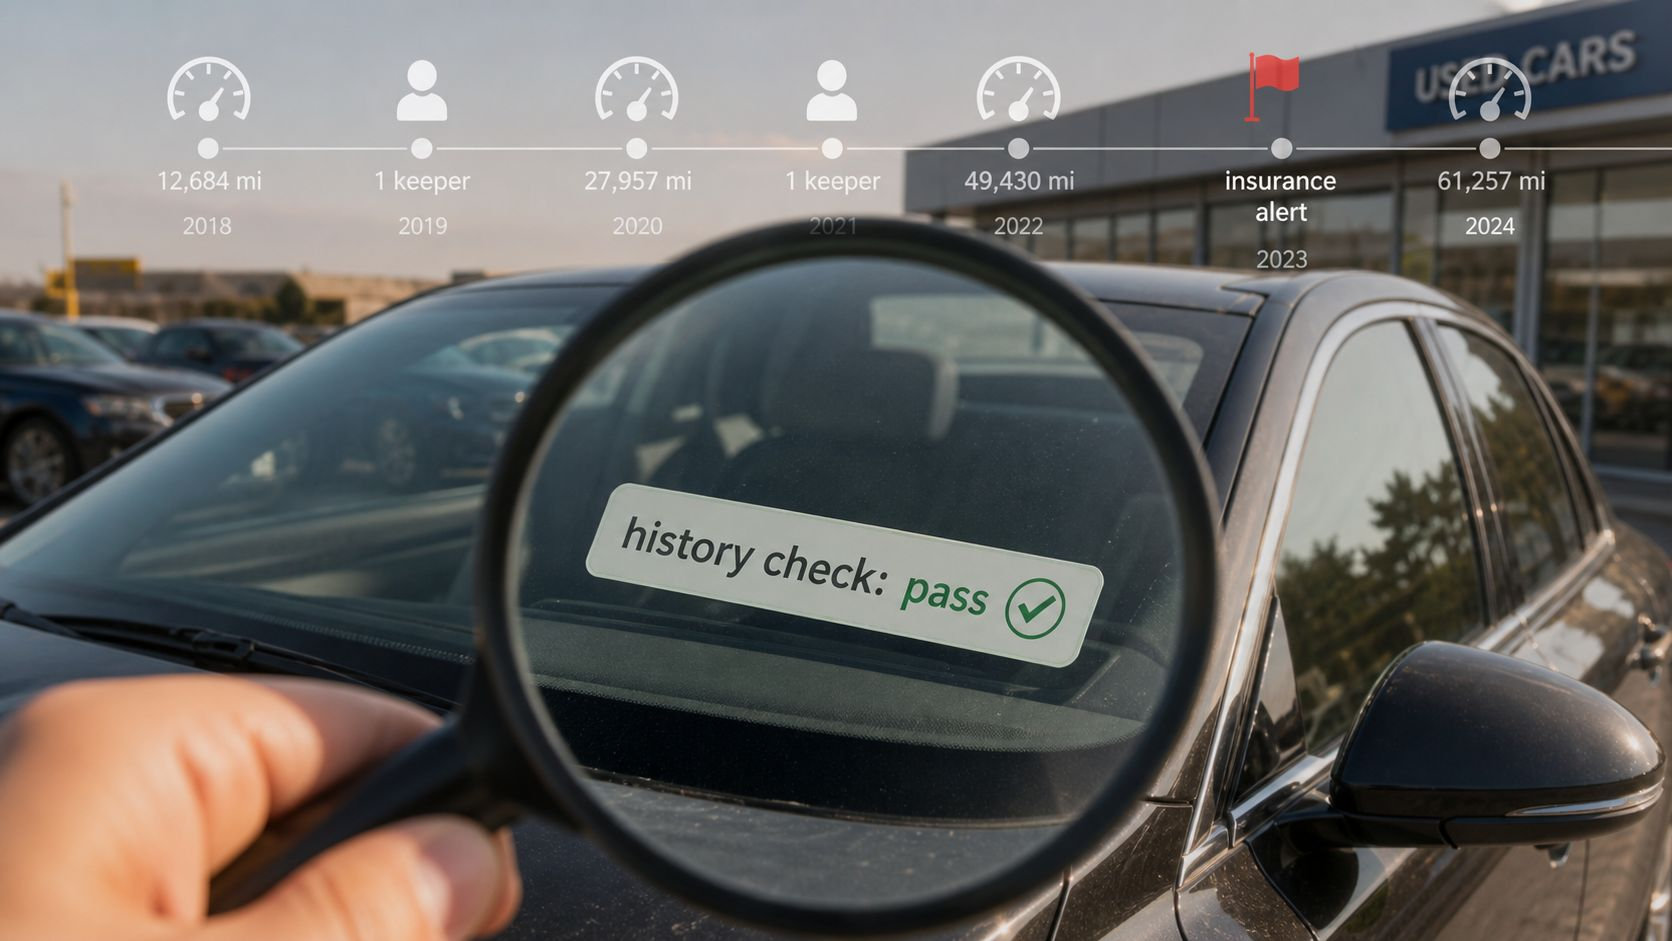
The better question is not whether one record passes, it is whether the pattern holds together. A single snapshot can confirm a point in time, but it cannot tell you whether the vehicle's mileage, ownership, or condition has been moving in a direction that matches the asking price. That is why historical trend analysis belongs in trade decision-making, not as a replacement for standard checks, but as the layer that tells you whether the file is coherent.
Why traditional provenance checks are no longer enough for professional traders makes sense only if you already accept this principle. A basic check can still be useful, but it is only one point on a line. Dealers make better buying decisions when they ask what happened before that point, what changed after it, and whether the latest record fits the rest of the vehicle provenance.
Practical rule: if the file only tells you the car exists, it's incomplete. If it shows how the car has moved through time, you can start judging risk.
What Historical Trend Analysis Means in Vehicle Provenance
In the motor trade, historical trend analysis means reading a vehicle's records as a time series, not a static fact sheet. The difference matters. A point-in-time check may tell you about finance, theft, or write-off status on the day you run it, but it does not show how mileage, keepers, or MOT outcomes have evolved across months and years.
Direction matters more than isolated records
That long view is where the useful signal sits. A vehicle can look fine at one checkpoint and still sit on a bad trajectory, especially if the recent pattern is inconsistent with its age, class, or apparent condition. Analysts in other domains use moving averages, trend lines, and regression to separate underlying direction from short-term noise, and the same logic applies to vehicle provenance when you are trying to judge whether a car's record is stable or deteriorating. The point is not to forecast the future with certainty, it is to understand whether the current pattern is reliable enough to buy on.
What the method is, and what it is not
Historical trend analysis in the trade is a decision-support discipline. It helps dealers identify whether the vehicle's recent story makes sense, whether records line up across dated sources, and whether a clean snapshot is being supported by a believable timeline. It does not guarantee condition, and it does not turn incomplete records into proof of safety.
The best way to think about it is simple, a vehicle with a coherent timeline gives you more confidence than one with scattered or contradictory events. That is why the recent trajectory often matters more than distant history. A car with a tidy early record but a questionable last twelve months deserves more scrutiny than a vehicle with older, settled issues that are already accounted for in price and expectation.
UK Data Sources That Feed a Provenance Timeline
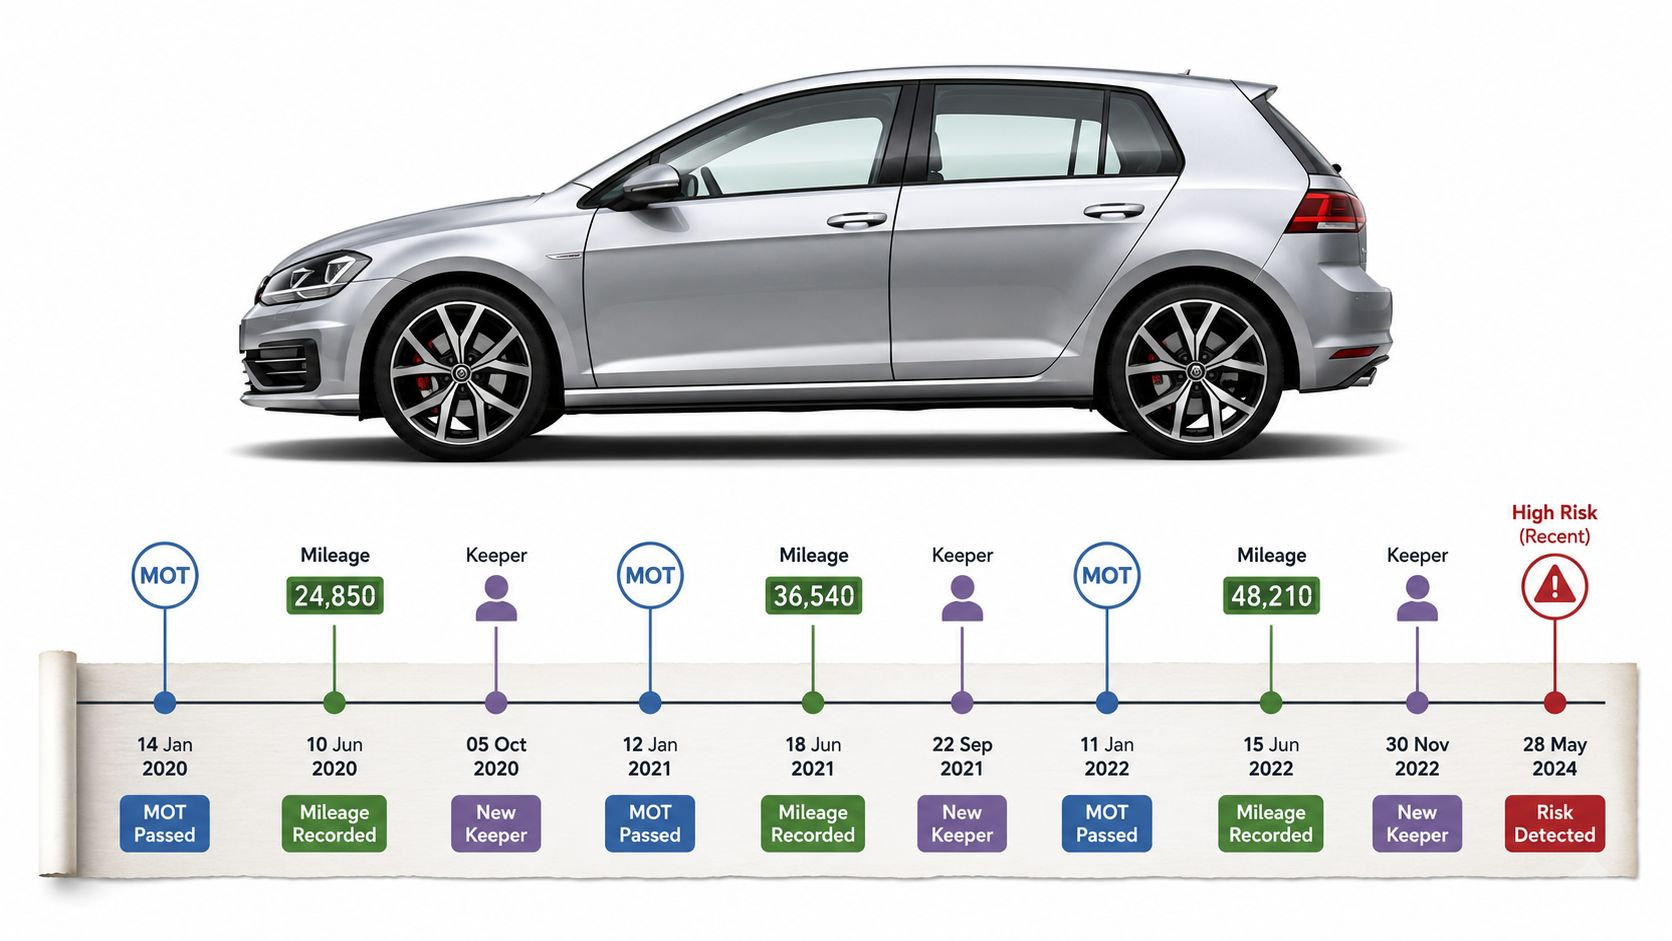
A useful vehicle provenance timeline starts with dated records. In the UK, that usually means DVLA-style keeper continuity, MOT history, mileage readings, ownership intervals, and any insurance-related markers that indicate a past total loss, theft recovery, or similar event. Each source adds a different layer, and each has blind spots. A good used car history report doesn't pretend one feed is enough, it treats the sources as complementary.
What each source actually contributes
DVLA-related ownership records help you see how long a keeper held the car and whether the change pattern looks settled or restless. MOT history gives you dated test outcomes, advisory notes, and recorded mileage points, which makes it useful for checking whether the vehicle's present story matches its past use. Mileage readings matter because they create anchors in the timeline, while ownership durations can expose quick turnover that a static check might miss.
Insurance-related events matter because they can explain why the file suddenly changed direction. A vehicle can sit in one database and still carry a significant event that only becomes visible when the right records are compared side by side. The practical issue is that these datasets update on different cadences, so one source can lag behind another, and gaps or reporting quality issues can distort the picture if you read any one record in isolation.
Dealer takeaway: the timeline is only as strong as the weakest record, so treat gaps as information, not as empty space.
UK Data Sources That Feed a Provenance Timeline
The strongest workflows don't rely on the file being complete. They use corroboration, especially where one record can be checked against another. That approach lines up with the broader guidance that trend analysis works best when the data is cleaned, validated, and tested against independent references before anyone draws a conclusion.
For UK dealers, that means the value comes from combining sources that were never designed to answer the whole question by themselves. A MOT record might show a mileage point, a keeper timeline might show short-duration ownership, and an insurance marker might explain a sudden change in the story. Put together, they create a provenance trail that is much more decision-ready than any single snapshot. AutoProv's data sources page lays out the kind of multi-source structure that supports that workflow: AutoProv data sources.
Methods That Turn Records into Risk Signals
Once the records are lined up, the job is to separate signal from noise. That's where the analytical methods matter, because dealer vehicle checks become more useful when they're built around direction, deviation, and corroboration rather than raw record count. A vehicle can have plenty of data and still tell you very little unless you read it against itself.
Four methods that change the buying decision
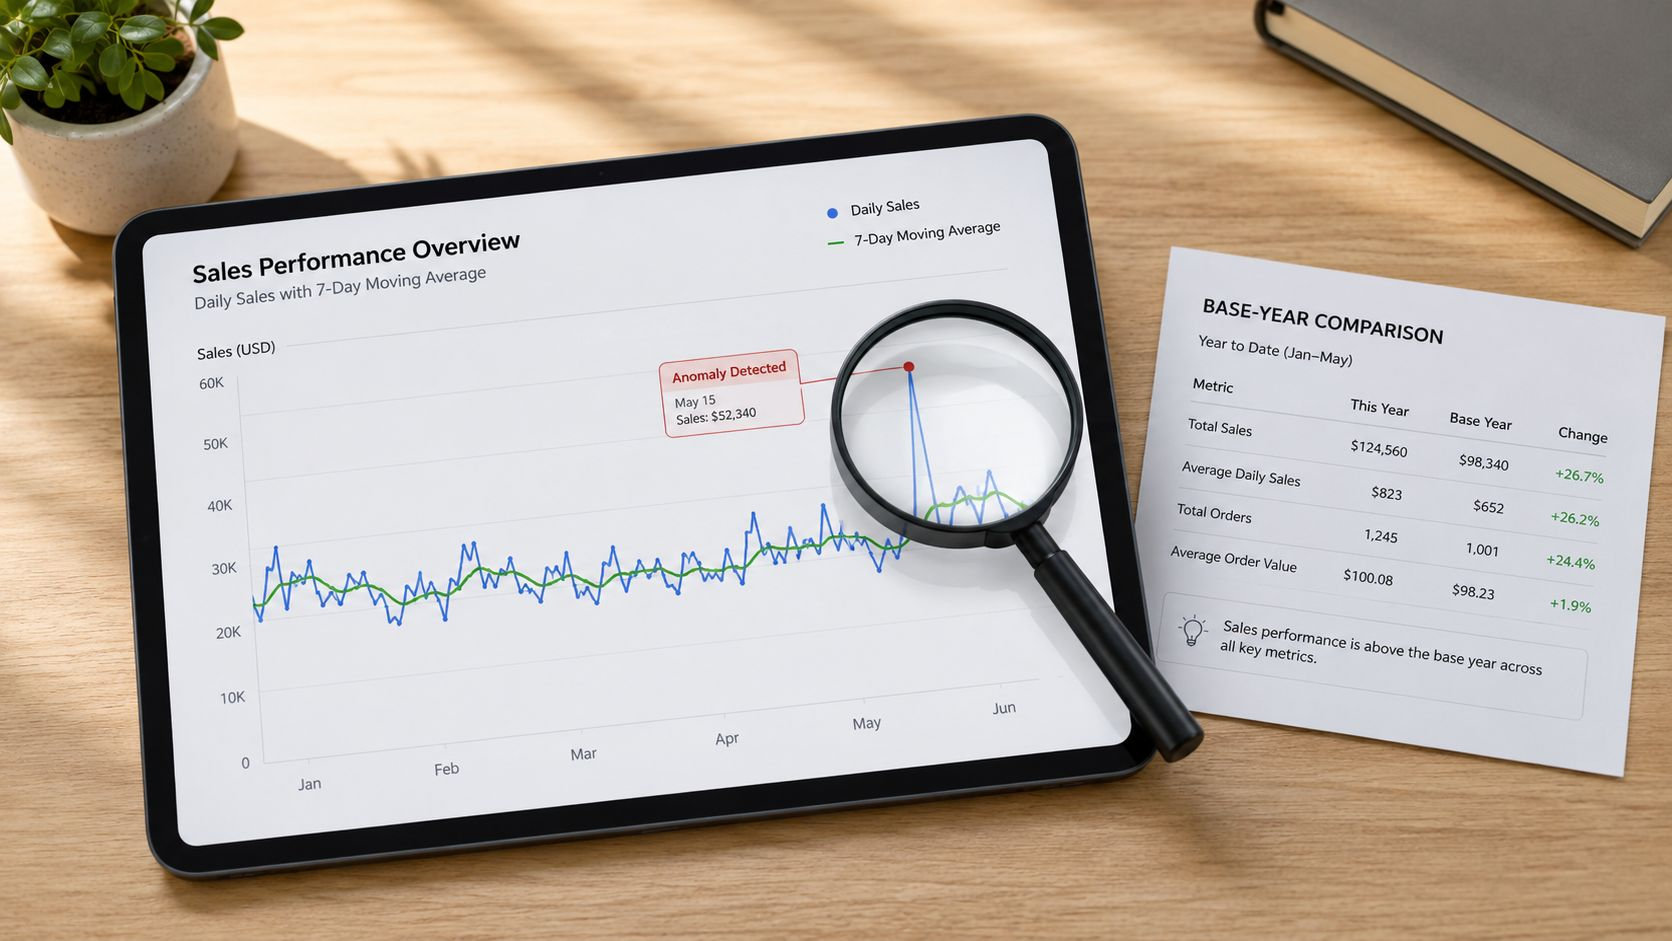
Moving averages smooth volatility. If mileage or advisory patterns bounce around, a moving average helps you see whether the underlying direction is stable or whether the recent points are drifting away from the earlier norm.
Base-year comparison is especially useful when a vehicle has enough dated history to anchor a benchmark. By comparing later values against an earlier baseline, you can spot whether the trajectory has stayed plausible or moved in a way that needs explanation. That works well for mileage trend analysis UK buyers care about, because the question is often whether the current path still fits the vehicle's earlier pattern. A base-year method is a structured way to compare the vehicle with itself, not with a generic average.
Anomaly detection looks for sudden jumps, odd gaps, or keeper changes that don't match the rest of the timeline. A sharp mileage step or an unusual ownership cadence isn't proof of fraud, but it is a reason to dig deeper.
Cross-source validation asks whether one record supports another. If MOT history, mileage points, and ownership timing all tell a similar story, confidence goes up. If they disagree, the disagreement itself becomes a risk signal.
Dealer rule: never let one clean-looking line override two awkward ones.
The practical discipline is simple. Clean the records, define the time window, and then test the vehicle's trajectory against independent dated sources before you decide whether the pattern is stable, deteriorating, or inconsistent. AutoProv's anomaly-detection discussion is relevant here because it frames irregularity as a workflow problem, not just a visual one: what anomaly detection means in vehicle risk work.
KPIs and Risk Signals Dealers Should Actually Monitor
A buying team doesn't need dozens of metrics. It needs a short list that exposes whether the vehicle's recent story is believable. The best motor trade risk indicators are the ones that combine chronology with context, because a single record can look harmless while the timeline around it is doing the damage.
The measures worth watching
Longitudinal mileage consistency asks whether the mileage path looks plausible for the vehicle's age and use pattern. Stable mileage progression is what you want. A deteriorating pattern shows sudden jumps, long unexplained gaps, or points that don't line up with other dated records. An anomalous pattern is one where the mileage story cannot be reconciled with the rest of the file.
Ownership churn rate is about how often the vehicle changes hands within the time window you care about. Stable ownership usually signals a settled history. Deterioration shows short keeper durations or a run of rapid transfers. A high-churn pattern often deserves closer questioning because it can reflect issues the file hasn't yet named.
MOT outcome trajectory should be read as a pattern, not a single pass or fail. A steady advisory history can be normal on an older vehicle. A worsening run of advisories, failures, and re-tests is more concerning because it shows the vehicle is moving in the wrong direction.
Cross-source consistency score is the practical question behind all the above, do DVLA-style records, MOT history, and mileage points agree with one another? If they do, the file is easier to trust. If they don't, the inconsistency itself becomes the risk signal.
How to use the signals without over-reading them
A clean score in one area doesn't rescue a weak pattern elsewhere. A car can have tidy ownership and still look poor on mileage consistency, or it can have acceptable MOT results while still showing a suspicious transfer pattern. The buying manager's job is to weigh the full record, not to crown one KPI as decisive.
The logic here lines up with the inventory risk assessment guide, because stock risk is rarely about one defect. It's about the combined shape of the record, and whether the latest movement makes commercial sense.
Two Trade Examples That Show the Difference
A buying manager sees a candidate vehicle that looks straightforward at first glance. The mileage base-year comparison doesn't sit comfortably with the recent record, the ownership timeline shows three keepers in eighteen months, and the MOT history supports the suspicion that the file isn't as tidy as it first appeared. The car is left alone. No drama, no debate, just a disciplined no.
The value of that decision is not just that it avoided a bad buy. It also kept the team from spending time pricing, reconditioning, and retailing a vehicle whose history was already telling them to slow down. Historical trend analysis didn't replace the basic check, it made the basic check meaningful.
A second trader runs a single check, sees nothing dramatic, and buys the same sort of car. Weeks later, an insurance-related event comes to light, and the vehicle is harder to retail at the planned margin because the story now needs explaining. The issue isn't that the car was necessarily impossible to sell, it's that the trade decision happened before the timeline was properly read.
What changed between the two decisions
The data didn't change. The interpretation did. One buyer treated the file as a sequence of dated signals. The other treated it as a pass/fail snapshot. That difference is often enough to separate a controlled purchase from a costly complication.
A Practical Workflow for Trade Stock Acquisition
A workable process doesn't need a rebuild. It needs order. Start by defining the time window you care about, then identify which sources are going to feed the analysis. If the vehicle has several dated records, use them together. If the timeline is thin, treat that thinness as part of the assessment rather than brushing past it.
A simple handoff that fits a buying desk
- Set the review window. Decide whether you're judging the last few records, the last ownership cycle, or the whole available timeline.
- Pull the dated sources together. Use DVLA-style ownership data, MOT history, mileage points, and any insurance-related markers that are available.
- Read for direction, not just presence. Ask whether the vehicle is stable, drifting, or contradictory.
- Document the decision. Record which signals were reviewed and why the vehicle was approved or passed over.
The same process works for a buyer, a stock controller, or a senior manager reviewing borderline stock. The important point is ownership of the workflow. Someone has to be responsible for the call, especially when the trend is mixed and the record needs judgement rather than an automatic verdict.
If you want a compact decision framework, the go no-go decision guide fits neatly beside a provenance workflow, because it turns ambiguous evidence into a repeatable buying call.
Best Practices, Pitfalls and How AutoProv Fits In
The cleanest rule is still the simplest one. Anchor analysis to dates, not averages. Treat each KPI as one input among several. Validate flagged patterns against independent UK records. And keep in mind that historical trend analysis is decision support, not a guarantee.
The main pitfalls are predictable. Dealers get into trouble when they lean on sparse data, ignore reporting lag, or assume that a single clean check proves the car is safe. They also get misled when they over-weight distant history and ignore the recent trajectory, which is usually where the commercial risk sits.
For teams that want a more structured way to handle provenance, AutoProv is built to assemble DVLA, MOT, mileage, ownership, and risk signals into one longitudinal view for the UK motor trade. It's the sort of workflow that suits buying managers who want a clearer point-of-decision picture rather than a simple pass/fail output. If fleet-style control is part of your wider operation, the guide from Blade Auto Keys is also worth reading because it shows how disciplined record-keeping supports asset control in a different but related context.
Before your next acquisition, use this short checklist. Confirm the timeline is dated, compare records across sources, look for sudden changes or short keeper runs, and challenge any file that only looks clean when viewed one page at a time.
AutoProv helps UK dealers turn a vehicle history check UK result into a proper provenance view, with mileage progression, ownership patterns, and other risk signals read as a timeline rather than a snapshot. If you're buying trade stock and want a clearer view of vehicle history, visit AutoProv and see how its reports support point-of-decision risk assessment.
Frequently Asked Questions
AI-Generated Content Notice
This article was created with the assistance of artificial intelligence technology. While we strive for accuracy, the information provided should be considered for general informational purposes only and should not be relied upon as professional automotive, legal, or financial advice. We recommend verifying any information with qualified professionals or official sources before making important decisions. AutoProv accepts no liability for any consequences resulting from the use of this information.
From our AI insights
- Advanced Mileage Verification for UK Dealers
Explore innovative mileage verification tactics for UK car dealers to mitigate risks and enhance negotiations.
- Harnessing Real-Time Data in UK Motor Trading
Explore how real-time data aids UK traders in identifying vehicle risks swiftly.
- Predictive Insights: Using DVLA Data for Stock Risk Analysis
Explore how DVLA data transforms into predictive insights for UK car dealers managing stock risk.
Related Articles

Navigating the UK Used Car Market
Explore the latest trends in the UK used car market and how AutoProv can reveal true vehicle values.

Understanding Market Insights for Vehicle Pricing
Learn how market insights can guide UK traders in setting the right vehicle prices.

7 Best Second Hand Cars to Buy UK: A 2025 Guide
The search for the best second hand cars to buy in the UK can feel like navigating a maze of private listings, vast online showrooms, and conflicting advice. With prices fluctuating and new models constantly entering the used market, how do you identify a reliable, fairly-priced vehicle that truly suits your needs? This guide is designed to cut through the noise and provide clear, actionable insights for your next purchase.
Published by AutoProv
Your trusted source for vehicle intelligence