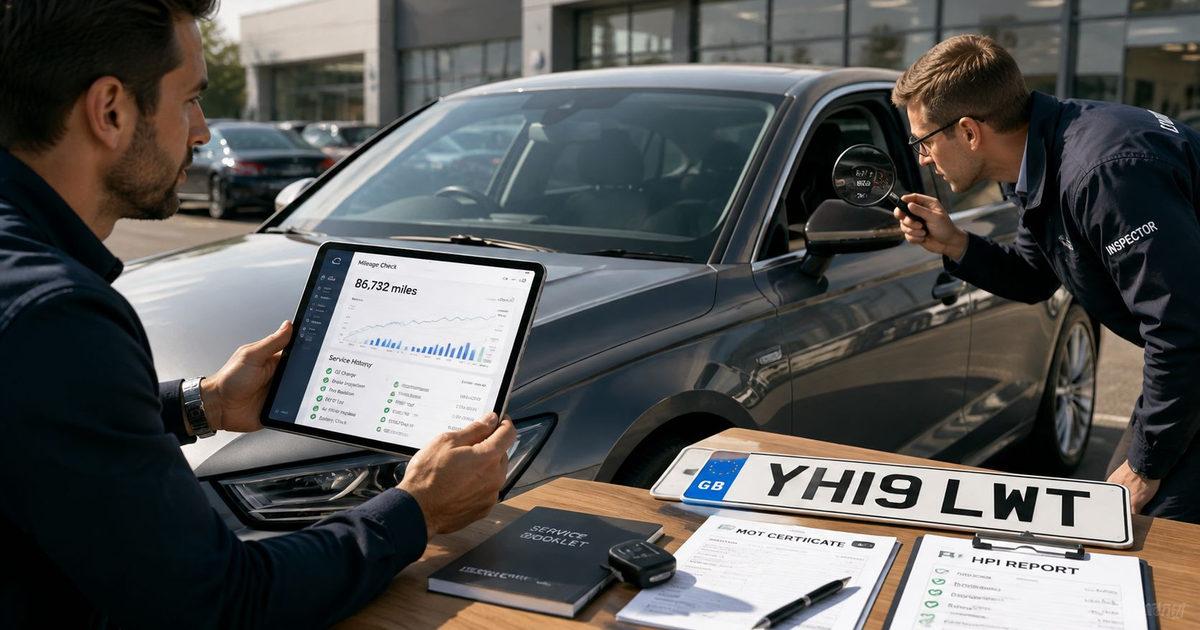
A clean-looking history report can lull buyers into false confidence. In the UK used car market, that's a costly mistake, because vehicle history check UK data only gives part of the picture, while the buying decision depends on vehicle provenance, ownership timing, MOT patterns, mileage evidence, insurance events, and trade movement all lining up. For motor traders, the question isn't whether a report is present, it's whether the report and the car's physical story agree.
That matters at scale. SMMT data shows 7,807,872 used vehicles changed hands in 2025, up 2.2% year on year, and Q2 2026 reached 2,009,318 transactions, a 0.7% increase versus Q2 2025 and the first second quarter to pass two million since 2021, which means small improvements in checking can affect a very large number of purchases (SMMT used car sales data). Buyers also entered 2026 with higher retail pricing pressure, with Autotrader reporting an average used-car retail price of £17,294 in January 2026, the highest monthly average since November 2023, based on 800,000 daily observations across the market (Autotrader market update).
AutoProv fits into that gap as trade vehicle intelligence, not just a basic report. It helps dealers connect the dots between dealer vehicle checks, MOT history, mileage patterns, keeper movement, and risk signals before capital is committed. The nine checks below turn used car buying advice into a layered acquisition process, one that supports valuation, negotiation, compliance, and post-sale risk control.
Table of Contents
- 1. Ownership Pattern Analysis and Short-Term Holding Risk
- What the timeline can and cannot prove
- 2. Mileage Discrepancy Detection and Odometer Inconsistency Tracking
- Read the shape of the data, not just the number
- 3. Accident History and Insurance Loss Event Correlation
- Correlate claim type with vehicle movement
- 4. MOT History Pattern Analysis and Test Failure Event Interpretation
- Use MOT patterns as a mechanical map
- 5. Flood and Water Damage History Detection and Risk Stratification
- What to look for when the car seems too clean
- 6. DVLA Registration and Recorded Defect Correlation Analysis
- Match the advert against the official record
- 7. Trade-to-Trade Transfer Velocity and Wholesale Pipeline Risk Assessment
- Speed is a clue, not a verdict
- 8. Specialist Use and Commercial Fleet History Impact on Retail Viability
- Usage history changes the valuation model
- 9. Geographic Risk Profiling and Regional Market Anomaly Detection
- Regional movement should change the inspection brief
- 9-Point Used Car Risk & History Comparison
- Turn Vehicle Intelligence Into a Buying Decision
1. Ownership Pattern Analysis and Short-Term Holding Risk
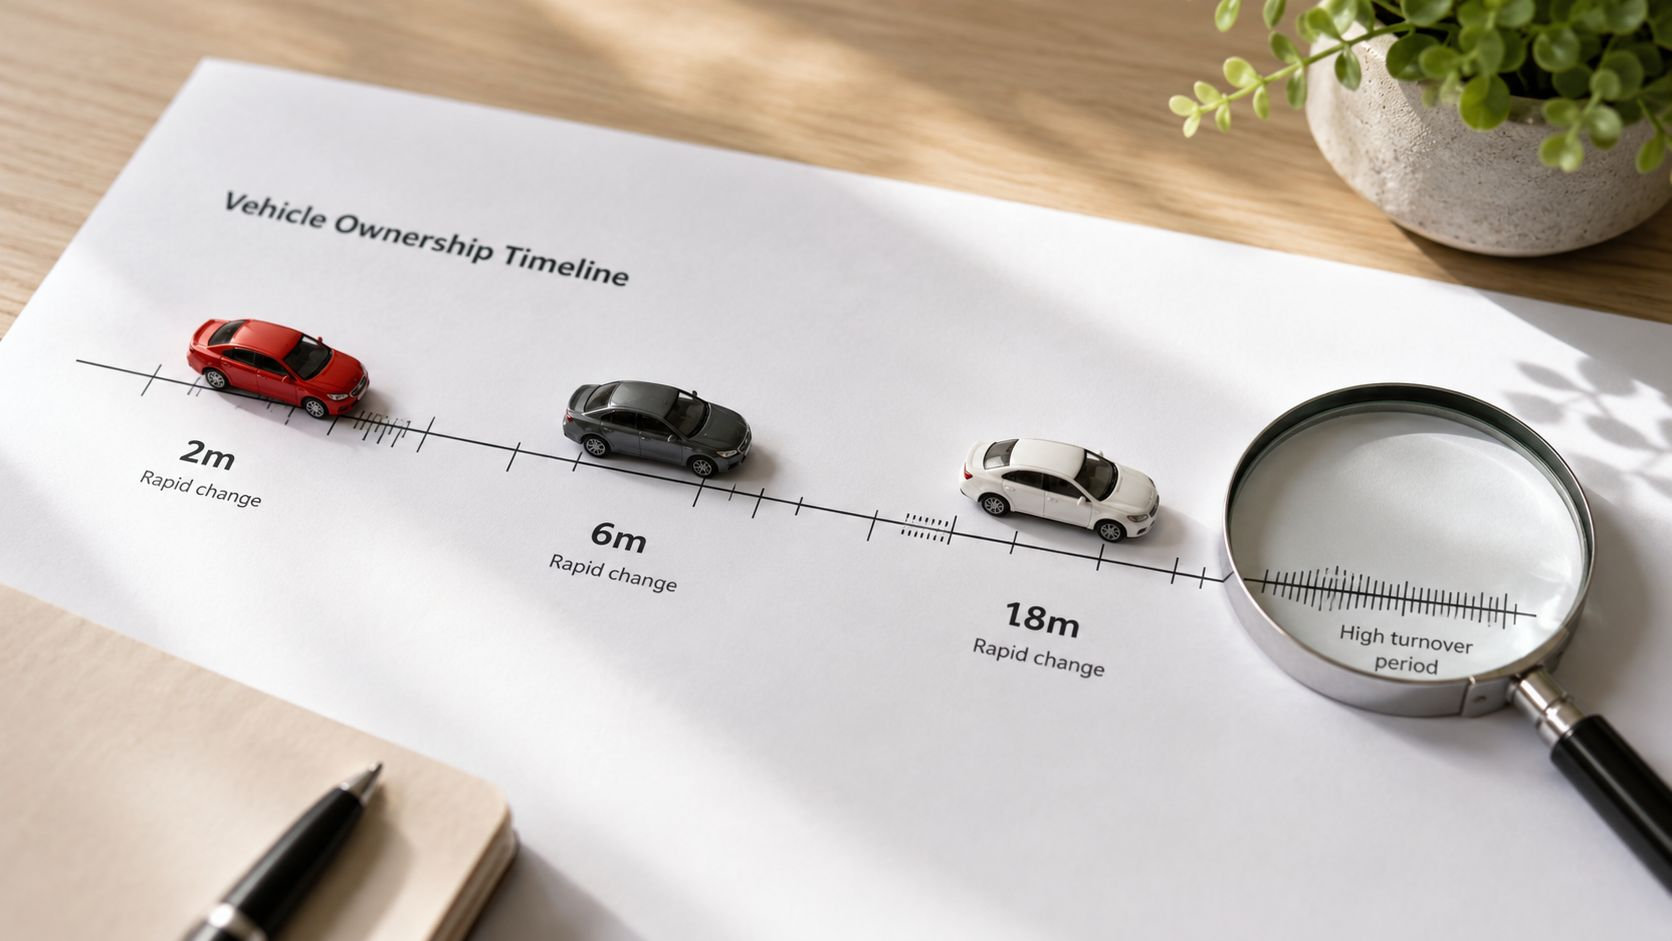
Short ownership doesn't prove a bad car, but it does tell you where to look first. A vehicle that has changed hands quickly, especially through several keepers in a short period, deserves closer scrutiny than a car with long, stable ownership and consistent supporting paperwork. That's because rapid keeper changes often sit alongside unresolved defects, disputed repairs, or a seller chain that's trying to move risk rather than own it.
The practical test is simple. Compare the keeper timeline with the MOT history, service stamps, and any seller explanation for why the vehicle moved on. If the story is thin, inconsistent, or changes between conversations, treat that as a sourcing problem, not a paperwork issue.
What the timeline can and cannot prove
An ownership timeline can't prove the reason for a sale, but it can expose patterns that don't fit normal retail use. A car that has spent years with one keeper usually gives you a cleaner baseline for valuation, while repeated short holds can justify a more conservative bid or a tighter warranty reserve. For trade buyers, that's where provenance intelligence outperforms a simple used car history report.
Practical rule: if the vehicle's keepership looks like a relay race rather than ordinary use, price it like a higher-risk stock acquisition until the paperwork and inspection say otherwise.
Request the full owner sequence and compare it with the seller's narrative. The internal guide on how many car owners a vehicle has had is useful here, because it helps frame ownership as a risk signal rather than a curiosity. Multiple transfers to the same address, business, or wholesale chain are especially worth isolating, because clustering often matters more than the headline number of keepers.
2. Mileage Discrepancy Detection and Odometer Inconsistency Tracking
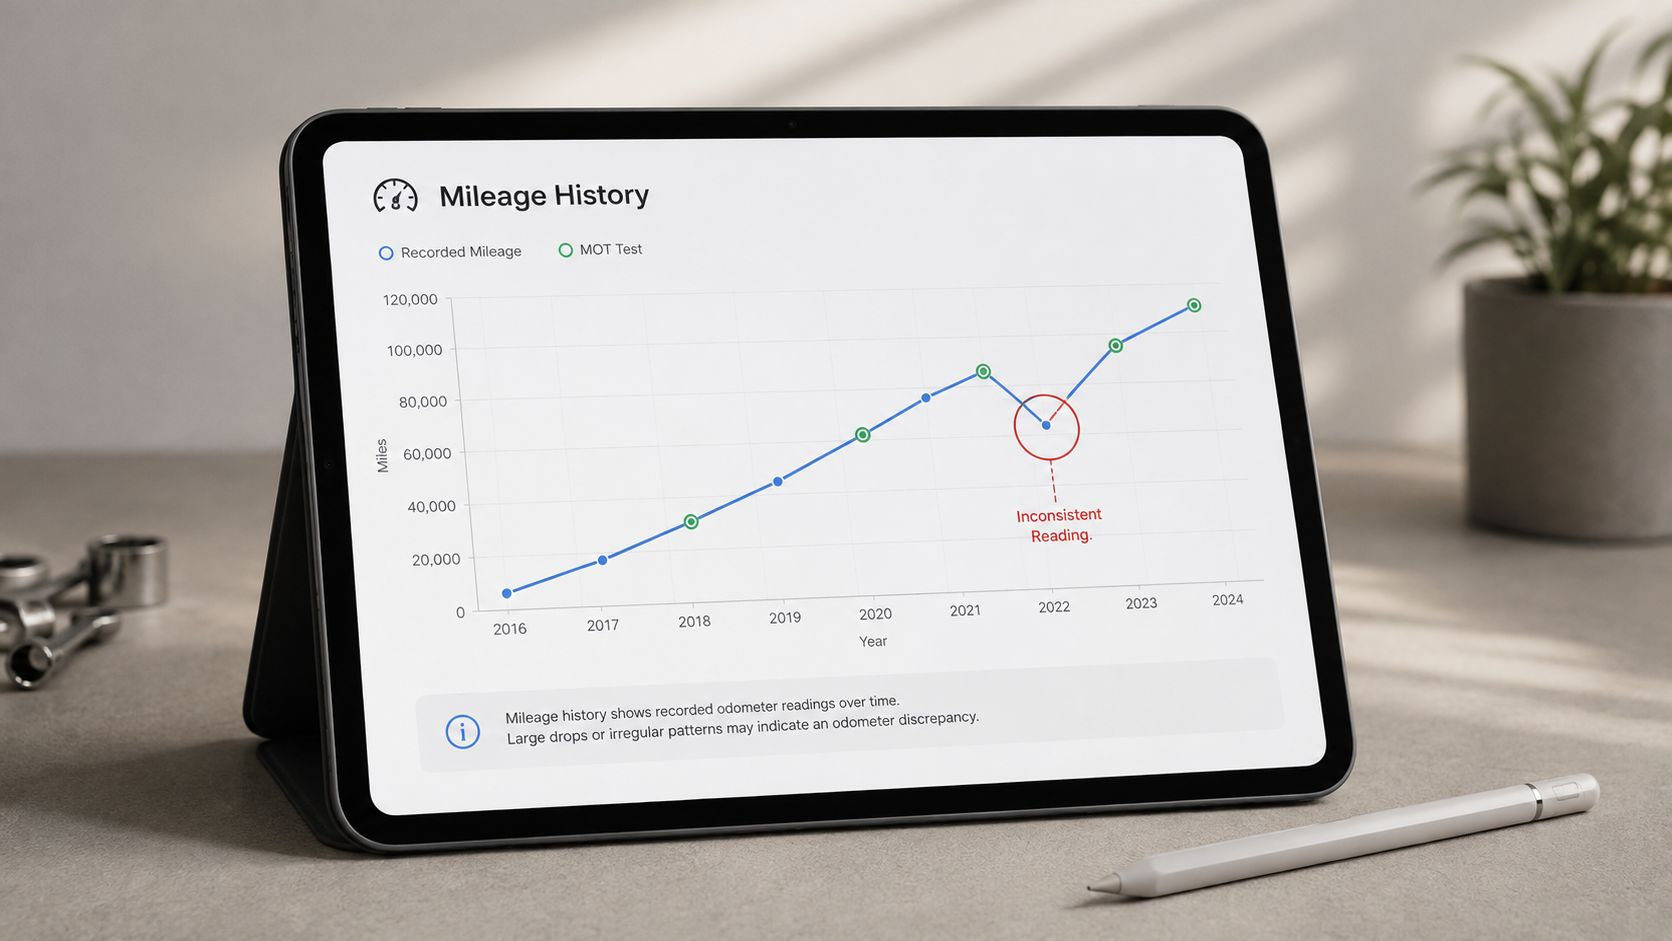
Mileage checks gain value through pattern analysis across MOT records, service entries, keeper changes, and other dated evidence. The aim is to establish whether the recorded increase fits plausible use, then identify gaps requiring sourcing, inspection, or valuation action. A vehicle can display a credible current figure while its supporting history remains incomplete.
The free GOV.UK MOT service has defined limits. It returns tests done since 2005 for cars, motorcycles and vans, and since 2018 for HGVs, trailers, buses and coaches, so older vehicles will not have a complete lifecycle record from MOT data alone (GOV.UK MOT history limits). A missing period does not establish wrongdoing. It does require the used car history report to be checked against service invoices, digital records, and the seller's explanation. The car history check mileage guide can help organise that comparison.
Read the shape of the data, not just the number
Plot the MOT sequence and examine its rate of change. Neat repeated steps across several years can merit scrutiny, while a sharp jump, stalled figure, or unexplained disappearance needs a documented explanation before the car enters stock. These patterns are risk signals, not proof of odometer tampering.
Autotrader's guidance records benign reasons for missing mileage data, including servicing information not being submitted or a keeper leaving mileage blank on the V5C during a keeper change (Autotrader mileage guidance). That distinction affects the next action. Ask for invoices or service-system entries, verify dates and mileages, and compare the result with vehicle wear and the proposed retail valuation.
A sound trade process should plot the MOT sequence, reconcile it with service and valuation records, and pause the purchase when the explanation fails to account for a material break. If the evidence remains unresolved, retain a risk allowance in the bid and commission a closer inspection rather than treating the anomaly as an automatic rejection. The mileage becomes a commercial input only after its provenance and physical plausibility have been tested.
3. Accident History and Insurance Loss Event Correlation
The core issue is claim type and subsequent vehicle movement. A single minor claim followed by documented repairs presents a different sourcing risk from repeated claims, unclear repair provenance, or a claim that conflicts with the vehicle's current condition. RAC research found that many private buyers purchased second-hand cars without checking their history, while fewer paid for a vehicle-history report or arranged a professional inspection (RAC research). The finding supports a practical trade conclusion: research time has limited value unless it produces evidence that can be verified.
Correlate claim type with vehicle movement
Identify what the claim involved, where the repair was completed, and whether supporting records can be matched to the vehicle. A theft or break-in claim may leave electrical, trim, or locking faults that a short walk-around will miss. A substantial claim with little visible evidence of structural work should trigger a more detailed inspection, because clean exterior panels cannot establish the quality of repairs beneath them.
The next signal is what happened afterwards. A rapid change of keeper, movement through trade channels, or a short holding period does not prove concealment, but it raises the need for stronger provenance and a lower tolerance for unanswered questions. Compare the claim date with invoices, keeper changes, auction or trade records, and the vehicle's present wear. Where the sequence is coherent, risk may be manageable. Where the sequence breaks, delay the bid until the gap is explained.
Practical rule: vague claim details, weak repair evidence, and accelerated keeper movement should place the vehicle in a higher-risk buying category.
Use the result in three decisions. Expand the inspection around likely repair areas, adjust the valuation for unresolved post-sale exposure, and preserve margin for rectification or customer support. AutoProv's insurance write-off check guidance can support that review, but the report remains one layer of evidence rather than a substitute for physical verification. A claim record can identify where to look. It cannot confirm that the car was restored properly.
4. MOT History Pattern Analysis and Test Failure Event Interpretation
A current MOT pass is not a clean bill of health. The record is more useful as a time-based evidence layer, showing whether defects recur, advisories worsen, or testing becomes irregular. A vehicle patched repeatedly between failures may meet today's legal requirement while carrying an immediate reconditioning risk.
GOV.UK confirms that buyers can review MOT history and recorded mileage. Its guidance also explains that a test-station mileage error can be corrected within 28 days through the GOV.UK MOT correction route. A correction can fix the entry, but it does not erase the wider pattern. Repeated faults in the same area still require an explanation, supporting paperwork, and physical verification.
Use MOT patterns as a mechanical map
Recurring emissions advisories, repeated suspension wear, or “minor” items that remain across tests indicate deferred maintenance more reliably than a single pass. They do not prove neglect on their own. Different testers may describe the same condition differently, and a repair may have resolved the underlying fault before a later test. Treat the sequence as a reason to inspect, not as a verdict.
Review three points:
- Does the same defect return?
- Do advisories become more serious?
- Is the testing timeline regular, or are there unexplained gaps?
A negative pattern creates two commercial questions. Which components need inspection or replacement before retail, and how should the purchase price preserve margin for that work? A coherent record may support a normal valuation. An interrupted record with recurring faults should delay the bid until invoices, test history, and current condition align.
For a dealer-focused checklist, AutoProv's MOT red-flag guidance for dealers explains how advisories can function as early warnings. Use it alongside a ramp inspection and diagnostic scan. A clean pass with a disorderly advisory trail carries a different sourcing risk from a stable, uneventful MOT record, even though both vehicles are currently compliant.
5. Flood and Water Damage History Detection and Risk Stratification
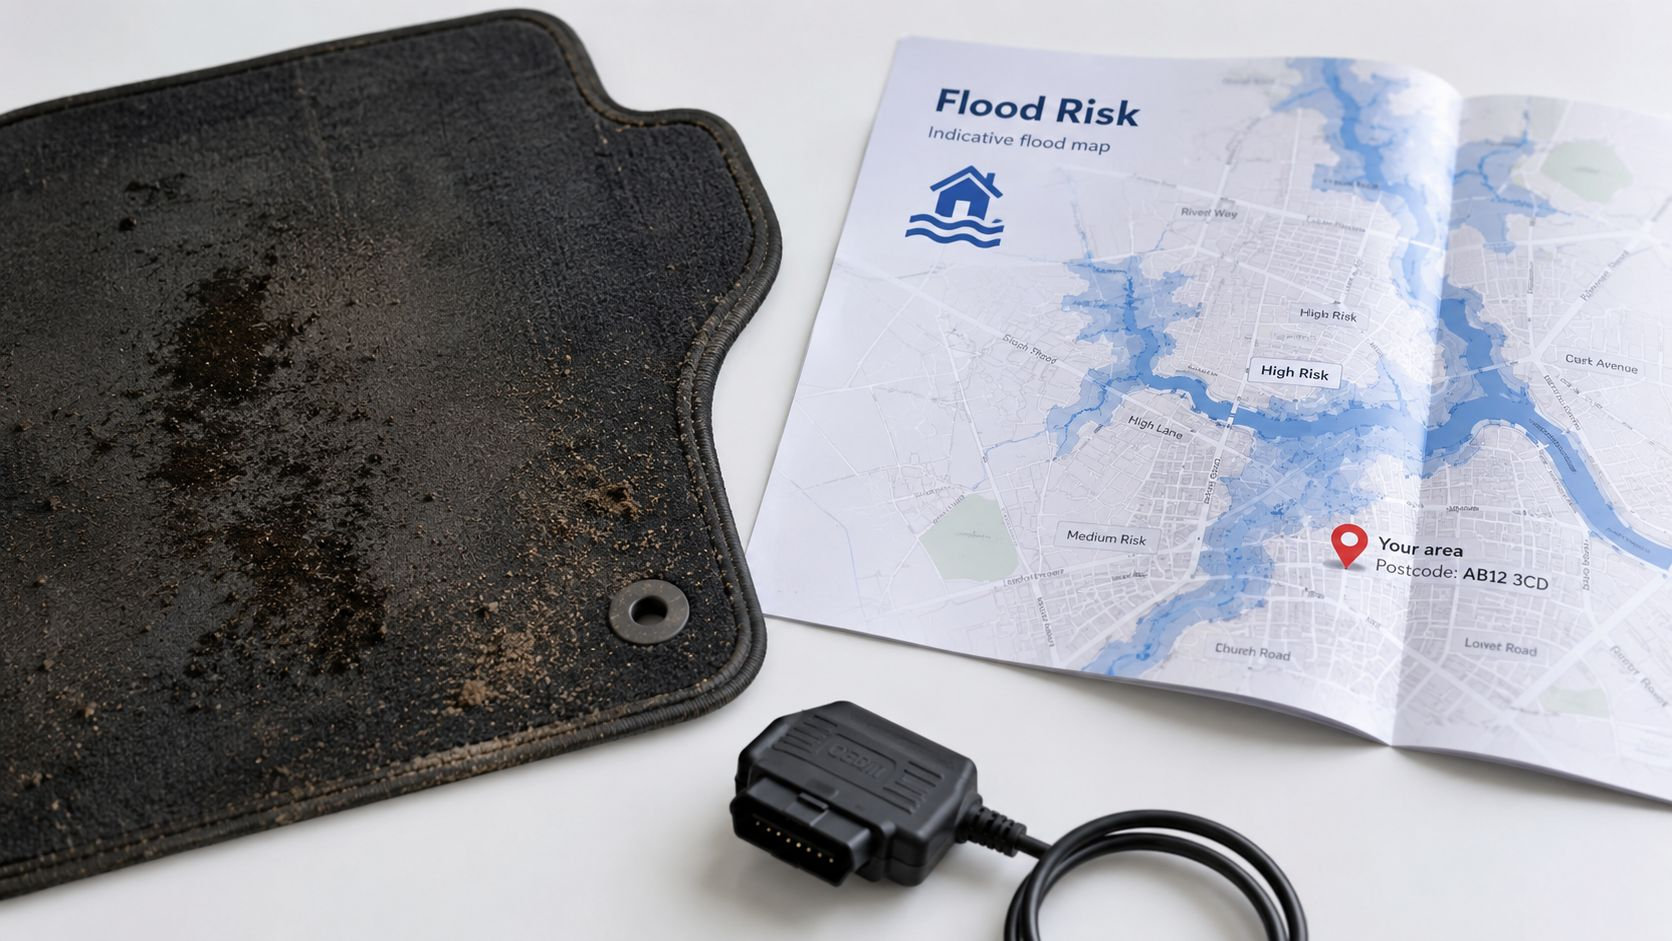
Water damage is one of the hardest problems in used car buying advice because the vehicle can look presentable long after the damage has started. Electrical faults, corrosion, intermittent warning lights, and interior odours can emerge well after retail handover, which makes flood history especially important for dealers who need to control comeback risk. A clean body shell does not rule out water exposure.
The best defence is cross-referencing. If the vehicle's location, claim history, ownership timing, and component replacement pattern all point in the same direction, the risk rises quickly. The government's flood-risk mapping and local historic weather records are the right starting point, but the evidence only becomes useful when you connect it to the car's paper trail and the physical inspection.
What to look for when the car seems too clean
Water damage often shows up in clusters, not one dramatic sign. Multiple electrical replacements, unusual corrosion underneath, damp smells hidden by strong air freshener, or odd behaviour in the central locking and infotainment system all deserve attention. A vehicle can still be retailable after flood exposure, but the warranty reserve and pricing need to reflect the long-tail risk.
A car that looks sorted on the forecourt can still be a problem car if the electronics are quietly failing one module at a time.
Trade buyers should also pay close attention to sourcing channel. Vehicles that move quickly through auction or wholesale routes after regional flooding can carry hidden issues that are easy to miss in a brief appraisal. AutoProv's vehicle data source guide is a useful reference point for how layered data makes these cases easier to spot.
The buying decision here is not binary. Some cars with historic exposure can be acquired safely if the evidence is complete and the repair quality is strong. Others need to be walked away from because the likely post-sale support cost is too hard to contain.
6. DVLA Registration and Recorded Defect Correlation Analysis
DVLA registration data can expose risk that a basic history check misses. Compare the vehicle's official identity with its advert, invoice and inspection record. Differences in engine size, body type, transmission or colour may reflect an innocent listing error, but they can also point to cloning, an engine change, incorrectly recorded specifications or stock that has been described loosely through a commercial chain.
The record cannot prove which explanation applies. It does establish a verification task before you value the car. If the DVLA record lists one engine size and the advert another, obtain supporting documents and inspect the vehicle identification details. Keep the valuation provisional until the discrepancy is resolved.
Match the advert against the official record
Check the core specification against the official registration data, then compare it with the physical car. A single mismatch may be administrative. Several mismatches suggest that the seller has not established provenance properly, or that the description is being used to present the vehicle more favourably. The appropriate response is documentary verification, not an automatic rejection.
Keeper type adds context. A sequence involving businesses rather than established dealerships can indicate commercial use or repeated movement through the trade. It does not demonstrate a defect, and it cannot by itself show that the car is unsuitable for retail. It should, however, reduce reliance on verbal assurances and increase the importance of invoices, identity checks and a careful appraisal.
Commercial rule: if the registration story and the sales story do not match, require evidence before accepting the sales story.
For dealers, inconsistent registration data affects both compliance and negotiation. Re-cost the vehicle for the time required to verify its identity and correct the record, rather than valuing only the apparent margin. AutoProv's trade focus makes Dealer Vehicle Checks more practical by combining registration intelligence with other provenance signals at the buying decision.
7. Trade-to-Trade Transfer Velocity and Wholesale Pipeline Risk Assessment
Rapid movement through the motor trade is a risk signal, not a verdict. A vehicle bought, passed on and resold in quick succession may have exposed an issue that each holder preferred not to carry. It may also reflect pricing pressure, auction strategy or a failed retail appraisal. Transfer speed shows that the vehicle has repeatedly been assessed commercially, but it does not prove a mechanical or legal fault.
The key question is where the risk has been left. Stock held by an established dealer generally offers more time for inspection and preparation than a car moved through auction, several traders or export-oriented channels before any buyer completes a detailed appraisal. A short wholesale cycle can therefore indicate limited evidence of retail suitability, rather than a poor vehicle in itself.

Speed is a clue, not a verdict
Treat the transfer pattern as a set of questions. Why did the car leave the previous trader quickly? Was the margin wrong, did the appraisal uncover preparation costs, or does the paperwork omit relevant context? Each explanation leads to a different inspection route and valuation.
Check transfer dates against auction records, invoices, preparation work and the seller's account of the vehicle's history. Look for evidence that supports a stable retail proposition, such as completed repairs, consistent specifications and a credible reason for each handover. Missing evidence should not be converted into a definite fault, but it should reduce the price you are prepared to pay.
Commercial takeaway: a short holding period should lead to a tighter inspection, a more conservative bid or a larger allowance for warranty and preparation costs. Reassess the vehicle if the wholesale route appears designed to reset buyer perception rather than document improvement.
AutoProv's provenance tools can help connect transfer velocity with observable history signals instead of relying on instinct. For a trade buyer, the decision is whether each handover adds evidence, or merely explains why the car keeps changing hands.
8. Specialist Use and Commercial Fleet History Impact on Retail Viability
Mileage can understate the workload placed on a car. Fleet, rental, driving school and other specialist use may concentrate wear over a shorter period, particularly in the clutch, gearbox, brakes, suspension and interior controls. The odometer records distance, not how often the vehicle stopped, started, carried different drivers or operated under commercial demands.
Usage category therefore belongs in the provenance assessment. A commercial background does not establish that a car is unsuitable, but a history report without that context can make intensive service appear routine. The retail question is whether the vehicle's condition, documentation and likely support costs still fit private-buyer expectations.
Refer to a complete fleet maintenance guide for context on how commercial use profiles differ from private ownership.
Usage history changes the valuation model
A rental or driving-school history should alter the inspection brief before any offer is made. Check clutch engagement, brake wear, gear selection, seat bolsters, steering-wheel wear and service timing. A tidy exterior cannot verify that repeated short journeys, multiple drivers or stop-start work have left no mechanical or cosmetic cost.
Ask the seller to identify the previous use category, then inspect the components that category would be expected to stress. If the explanation is vague, or invoices and registration records conflict with it, treat the gap as valuation uncertainty rather than proof of a fault. Price in an independent inspection, likely preparation and warranty exposure before bidding.
The wholesale route also matters. A vehicle moving directly from fleet disposal through trade channels into retail has less evidence of stable private ownership than one supported by a clear service file and consistent condition. That route should prompt closer provenance checks and a lower tolerance for unexplained defects.
Practical rule: intense use should reduce the weight given to mileage and increase the weight given to component condition, service evidence and post-sale cost.
For stock controllers and remarketing teams, AutoProv can sit alongside fleet records and inspection notes, helping match the use profile with expected retail support and a defensible valuation.
9. Geographic Risk Profiling and Regional Market Anomaly Detection
Location history can explain a lot about a car that looks ordinary on paper. Regional movement from flood-prone, corrosion-prone, or high-theft areas can create hidden risk, especially when the vehicle's usage story doesn't match the places it's been registered. A rural advert for a vehicle that spent its life in a dense urban market should prompt more questions than a sales description normally would.
Geographic risk profiling is useful because it adds context to every other check. If a vehicle comes from a region with more water exposure, more salt, more theft, or more intensive use, the inspection should shift accordingly. The data does not prove harm, but it does tell you where probability sits.
Regional movement should change the inspection brief
If a car has been relocated from a flood-risk area or a high-theft postcode and then reappears in a new market with a polished sales story, the provenance needs tighter verification. Likewise, a vehicle that spent years in central London and is now being sold as a lightly used rural car should be checked against the actual mileage, ownership timing, and seller narrative.
That matters because buyers often trust the story that feels most comfortable. A “retired couple” narrative can sound persuasive, but it should still be tested against the location trail. When the location trail says something else, the narrative loses weight fast.
If the car's geography tells a different story from the advert, believe the geography first.
For trade buyers, location history is a pricing tool as much as a risk tool. It helps explain why two seemingly similar vehicles shouldn't be valued the same way. AutoProv's motor trade risk approach is built for that kind of contextual reading, where the answer isn't just whether the car exists, but where it's been, how it moved, and what that means for the next buyer.
9-Point Used Car Risk & History Comparison
Analysis Area Implementation Complexity 🔄 Resources & Speed ⚡ Expected Outcomes ⭐ / 📊 Ideal Use Cases 💡 Key Advantages ⭐ Ownership Pattern Analysis and Short-Term Holding Risk 🔄 Moderate–High, cross‑referencing DVLA + trader timelines ⚡ Moderate, DVLA + timeline processing, near‑real‑time possible ⭐ Detects rapid turnover signals; 📊 reduces acquisition of problematic stock ~20–35% 💡 Wholesale sourcing, pre‑purchase screening of traded vehicles ⭐ Reveals deliberate cycling, supports negotiation & valuation adjustments Mileage Discrepancy Detection and Odometer Inconsistency Tracking 🔄 High, multi‑source time‑series analysis required ⚡ Moderate, needs MOT, insurance, service records aggregation ⭐ Identifies odometer tampering patterns; 📊 prevents ~15–25% hidden wear costs 💡 Valuation, warranty underwriting, trade‑in validation ⭐ Provides objective mileage progression evidence for price & acceptance decisions Accident History and Insurance Loss Event Correlation 🔄 Moderate, claim categorisation and cost/severity analysis ⚡ Slow–Moderate, insurance data may be delayed or incomplete ⭐ Reveals claim clustering and repair quality; 📊 reduces warranty exposure (claims 3–4x higher if hidden) 💡 Assessing structural damage risk and major repair history ⭐ Distinguishes severity & repair pathway; supports rejection or re‑pricing MOT History Pattern Analysis and Test Failure Event Interpretation 🔄 Moderate, pattern detection across MOT cycles ⚡ Fast, MOT records widely accessible and structured ⭐ Identifies recurring defects and progressive deterioration; 📊 flags likely near‑term repairs (2–3x cost increase for repeat failures) 💡 Condition trend analysis, inspection prioritisation, mechanical survey scoping ⭐ Objective view of maintenance standards and failure trends Flood and Water Damage History Detection and Risk Stratification 🔄 High, correlating claims, geography, and component replacements ⚡ Slow, requires environmental and insurer correlation; investigative work ⭐ Detects flood exposure risk; 📊 prevents vehicles with 4–6x higher electrical/repair costs 💡 Post‑flood sourcing, coastal market screening, high‑risk postcode checks ⭐ Identifies latent water damage risk, protects long‑term warranty budgets DVLA Registration and Recorded Defect Correlation Analysis 🔄 Moderate, DVLA record verification and anomaly detection ⚡ Moderate, DVLA extracts are available but may need historical pulls ⭐ Finds registration/spec mismatches and keeper anomalies; 📊 reduces clone/misrepresentation risk ~10–15% 💡 Identity/spec verification, compliance checks, pre‑purchase documentation audit ⭐ Official DVLA evidence to validate specs and detect registration fraud Trade‑to‑Trade Transfer Velocity and Wholesale Pipeline Risk Assessment 🔄 Moderate–High, mapping trader chains and velocity metrics ⚡ Moderate, needs auction/trader data and historical patterns ⭐ Highlights rapid pipeline risk; 📊 correlates with 2–3x higher failure/complaint rates 💡 Sourcing strategy, avoiding problem wholesalers, due diligence on suppliers ⭐ Reveals risky trader sources and rapid‑turn patterns for sourcing decisions Specialist Use and Commercial Fleet History Impact on Retail Viability 🔄 Moderate, keeper category and insurance pattern analysis ⚡ Moderate, requires fleet identity checks and service records ⭐ Identifies intensive use and compressed maintenance risks; 📊 anticipates 2–4x higher maintenance costs 💡 Evaluating rental, fleet, driving‑school, and commercial vehicles for retail sale ⭐ Adjusts valuation for usage intensity, informs inspection focus and warranty reserves Geographic Risk Profiling and Regional Market Anomaly Detection 🔄 Moderate, geolocation mapping and risk correlation ⚡ Moderate, uses registration history and environmental datasets ⭐ Detects region‑based risks (flood, corrosion, high‑theft); 📊 improves sourcing quality by ~10–25% when combined 💡 Detecting relocated/repositioned vehicles, regional arbitrage, flood/corrosion checks ⭐ Provides origin context to spot repositioned or regionally compromised vehicles
Turn Vehicle Intelligence Into a Buying Decision
The strongest used car buying advice is not a single check, it's a repeatable decision process. Start with the source, run a layered vehicle history check UK and provenance review, inspect the car against what the data says, classify any anomaly by severity, then adjust price, warranty reserve, and negotiation stance before you commit. That sequence is what separates a basic compliance exercise from proper trade acquisition discipline.
Each of the nine checks works because it asks a different question. Ownership pattern analysis asks whether the car moved too fast to build confidence. Mileage analysis asks whether the numbers progress like real use. Claim history asks whether the damage story makes sense. MOT history asks whether the car has been ageing cleanly or being patched to pass. Registration, geography, and specialist use all add context that a single report can't capture.
No one signal proves a defect on its own. A missing record doesn't prove innocence, and a clean-looking document doesn't prove quality. The right response is to combine evidence, then decide whether the remaining uncertainty is acceptable for your margin, your warranty exposure, and your reputation.
For motor traders, that's the buying standard. Record what you checked, what matched, what didn't, and why you proceeded or walked away. That creates internal consistency, supports compliance, and gives your team a clearer basis for negotiation the next time a car looks fine at first glance but doesn't behave like a low-risk stock unit.
AutoProv fits naturally into that workflow because it brings trade vehicle intelligence into the point of purchase, where context matters most. Use it to contextualise DVLA, MOT, mileage, ownership, and risk signals before capital is committed, then keep the physical inspection and commercial judgement in the same decision frame.
Visit AutoProv to see how UK motor-trade provenance checks can support acquisition, valuation, and risk review before you buy. If you're assessing trade stock, its layered vehicle intelligence can help you read ownership, mileage, MOT, and risk signals together instead of in isolation.
Frequently Asked Questions
AI-Generated Content Notice
This article was created with the assistance of artificial intelligence technology. While we strive for accuracy, the information provided should be considered for general informational purposes only and should not be relied upon as professional automotive, legal, or financial advice. We recommend verifying any information with qualified professionals or official sources before making important decisions. AutoProv accepts no liability for any consequences resulting from the use of this information.
From our AI insights
- Leveraging Auction Data for Strategic Car Purchases
Discover how to use auction data effectively to make profitable car buying decisions.
- Auction Pitfalls: Avoiding Costly Mistakes
Navigate UK car auctions with confidence by avoiding finance, write-off, and mileage risks.
- Mastering Paint Code Checks: Detecting Hidden Car Repairs
Discover how to use paint code verification to identify hidden car repairs and ensure a smarter purchase.
Related Articles

Your Ultimate Guide to Buying a Used Car in the UK
Navigate the UK used car market with confidence using our comprehensive buying guide. Tips, checks, and AutoProv Provenance insights included.

Difference Between MOT and Service: What You Need to Know
An MOT is a mandatory legal inspection that every car on UK roads needs to pass.Think of it as the government's way of ensuring your vehicle meets the absolute minimum safety and environmental standards to be considered roadworthy. A service, on the other hand, is a completely different beast. It's the proactive maintenance routine recommended by the people who built your car, designed to keep it running smoothly and catch problems before they start. In short, an MOT is a pass-or-fail exam required by law. A service is a comprehensive health plan for your car.

Your Ultimate Used Car Inspection Checklist
A solid used car inspection checklist is the single most powerful tool you have to avoid buying a lemon. It gives you a methodical way to look past the shiny paint and assess a car's real condition, helping you spot hidden problems and get a fair price before you shake hands on the deal.
Published by AutoProv
Your trusted source for vehicle intelligence