

In the UK motor trade, a vehicle's mileage is a primary indicator of its usage and potential wear. However, relying on a simple national "average mileage for cars" provides limited insight for professional valuation. The current benchmark is approximately 7,000 miles per year, a significant decrease from previous decades. For any trade professional, understanding the context behind that figure is essential for accurate appraisal and risk assessment.
Decoding the Average Mileage for UK Cars
Appraising a vehicle using a single, nationwide average is an ineffective strategy. The key to accurate valuation lies in understanding what constitutes normal mileage for a specific vehicle's age, fuel type, and likely usage history. A generic benchmark is of little use when comparing a low-use private vehicle with a high-mileage ex-fleet asset.
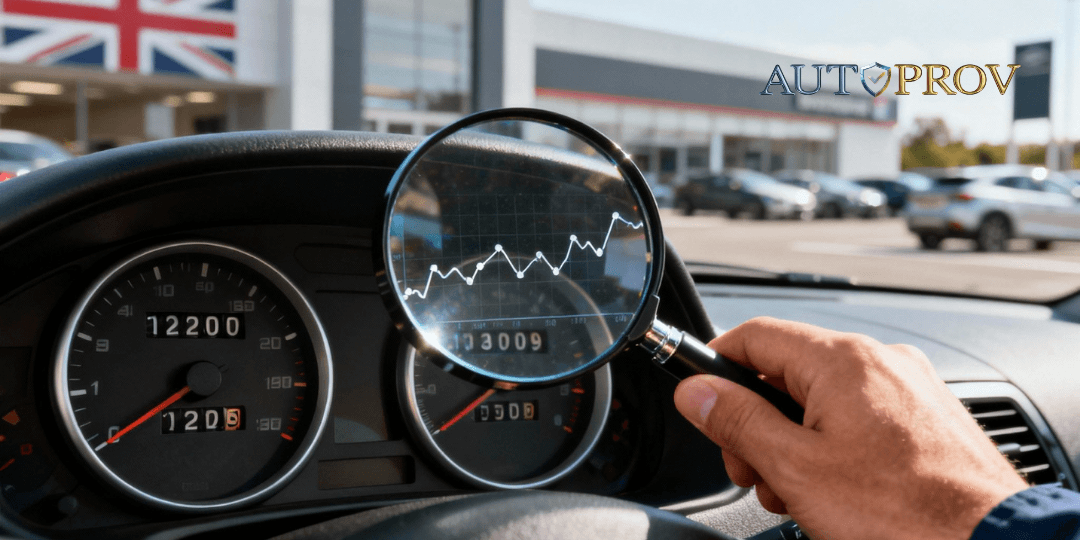
This infographic illustrates the decline in average annual mileage over the last two decades.

It is clear that vehicles today cover less ground than they did twenty years ago, a shift that directly impacts modern valuation models.
Declining Annual Mileage Trends
Over the last two decades, UK driving habits have changed significantly. In 2002, the average car in England covered approximately 9,200 miles annually. Today, that figure has fallen to around 7,000 miles—a decrease of roughly 24%. This is attributable to factors such as evolving commuting patterns and increased running costs.
For motor trade professionals, this trend requires a constant recalibration of valuation criteria. Historical assumptions of what constitutes "high" or "low" mileage are now outdated. A ten-year-old car with 70,000 miles is no longer a low-mileage outlier; it represents the expected average.
A vehicle's odometer reading is only a starting point. True vehicle intelligence comes from cross-referencing this figure against its specific history, ownership patterns, and service records to build a complete picture of its life and potential risks.
A Practical Benchmark for Vehicle Age
A more effective starting point for appraisal is to consider the expected total mileage based on the vehicle's age. This provides a quick reference framework to assess whether a car's mileage is within a plausible range. Correctly interpreting this is a critical part of determining what is a good mileage for used cars for retail stock.
This reference guide provides a general expectation of mileage accumulation.
Estimated Average Mileage by Vehicle Age in the UK
Vehicle Age (Years) Typical Annual Mileage (Miles) Expected Total Mileage Range (Miles) 1 7,000 - 10,000 7,000 - 10,000 3 7,000 - 10,000 21,000 - 30,000 5 7,000 - 10,000 35,000 - 50,000 7 7,000 - 10,000 49,000 - 70,000 10 7,000 - 10,000 70,000 - 100,000 Using age-based ranges helps to immediately flag vehicles that deviate significantly from the norm. If a vehicle falls well outside these brackets, it should trigger a deeper investigation into its provenance. This next level of analysis is what separates a standard acquisition from an intelligent one, protecting margins and professional reputation.
Why National Averages Don't Tell the Whole Story
Relying on a single national average for mileage is an inaccurate method for professional vehicle appraisal. This simplistic figure overlooks the crucial details that define a wide spectrum of 'normal' mileage. For a motor trader, these details are where profit is made or lost.
Understanding these nuances is the first step in moving from basic appraisal to sophisticated risk assessment. A vehicle's true history and usage patterns are far more indicative of its condition and value than a number on the odometer.
Petrol Versus Diesel Usage Patterns
The most significant factor that skews the average is fuel type. Petrol and diesel vehicles are typically acquired for different purposes, leading to substantial differences in annual mileage accumulation.
- Petrol Vehicles: Typically chosen for shorter, urban journeys such as school runs and local commutes. Their mileage is usually lower but reflects a life of stop-start driving, which can cause accelerated wear on components like the clutch and brakes relative to the distance covered.
- Diesel Vehicles: Historically the choice for high-mileage drivers, such as sales representatives or those with long motorway commutes. They are engineered for sustained cruising, meaning their higher mileage may correspond with less engine stress per mile compared to a city-driven petrol equivalent.
A 70,000-mile diesel that has primarily been used on motorways will have a completely different wear profile to a 40,000-mile petrol car used exclusively for urban journeys. To ignore this distinction is a fundamental appraisal error.
The Impact of Geography and Vehicle Use
A vehicle's geographical history is as important as its fuel type. The environmental context provides a richer picture of the mechanical stress it has endured—a story the odometer alone cannot tell. You can learn more about how location affects a vehicle by exploring the regional variations in UK mileage checks.
City-based cars accumulate mileage slowly but often suffer from accelerated wear on the gearbox, suspension, and brakes due to constant gear changes, speed bumps, and poor road surfaces. In contrast, a vehicle from a rural area might show higher mileage but has likely experienced a less stressful life on open roads, preserving its core mechanical components.
This is a critical piece of the provenance puzzle that directly impacts residual value and potential reconditioning costs.
Private Vehicle or Fleet Asset
A vehicle’s ownership history dictates its expected mileage far more than any national statistic. The distinction between a privately owned car and an ex-fleet asset is one of the most significant factors in provenance intelligence. A one-owner, privately used car covering 6,000 miles a year is perfectly normal.
However, a vehicle coming off a three-year lease from a corporate fleet will have an entirely different history. These are working assets, and their mileage reflects that. Data indicates the newest cars on UK roads accumulate mileage much faster, averaging 10,377 miles in each of their first three years.
Assessing a vehicle without understanding its ownership background is a high-risk strategy. A three-year-old car with 30,000 miles could be a solid ex-fleet purchase or a suspiciously high-mileage private car—context is everything.
A professional vehicle history check UK traders can rely on must go beyond raw numbers; it needs to analyse interconnected factors. AutoProv’s trade intelligence platform is designed to connect these dots, examining ownership patterns and historical data to provide the necessary context. This helps you determine if a vehicle's mileage is plausible for its likely history, transforming a simple number into a powerful risk assessment tool that protects your margin on every acquisition.
How Mileage Directly Impacts Your Bottom Line
In the motor trade, mileage is a direct driver of profit and loss. While retail buyers often default to the belief that 'low mileage is always better', experienced dealers understand the reality is far more nuanced. A sophisticated understanding of the link between an odometer reading, a vehicle's trade value, and retail buyer psychology is fundamental to protecting margins.
A car's mileage is one of the most powerful factors in its valuation, comparable to age and condition. Mileage serves as a proxy for wear and tear; higher mileage suggests more use and therefore more stress on the engine, gearbox, suspension, and other costly components. This direct correlation shapes how every vehicle is priced in the trade.

Critical Mileage Thresholds and Buyer Psychology
Certain mileage milestones act as psychological barriers for retail buyers, causing a vehicle's desirability—and therefore its value—to decrease sharply. The most significant is the 100,000-mile mark. Crossing this threshold can trigger a sudden drop in a car's value, even if the vehicle is mechanically sound.
This is not merely perception; there are practical reasons behind it:
- Perceived Mechanical Risk: Historically, 100,000 miles was seen as the point where major component failures became more likely. While modern vehicles are far more durable, this perception persists in the consumer mindset.
- Warranty Expiry: Most manufacturer and aftermarket warranties have long since expired by this point, leaving the next owner liable for repair costs.
- Future Resale Value: Buyers anticipate that a vehicle with over 100k miles will be more difficult to sell in the future, making them less willing to pay a premium for it now.
This psychological barrier creates a clear pricing dynamic. A vehicle with 95,000 miles will almost always command a higher price than an identical one showing 105,000 miles, despite the minimal difference in actual use. For a trader, acquiring a vehicle just below this threshold can provide a significant retail advantage. Understanding these financial tipping points is a key component of intelligent buying and pricing.
Finding the Valuation Sweet Spot
While very low mileage may seem attractive, it is not always an indicator of a superior asset. Vehicles that are significantly underused for their age can present their own unique problems. Rubber seals can dry out, batteries degrade, and fluids can settle, leading to unexpected reconditioning costs.
This introduces the concept of a valuation 'sweet spot'—the mileage range that indicates consistent, regular use and, crucially, proper maintenance. A three-year-old car with 25,000 miles, for example, is often a more reliable proposition than one with just 5,000 miles. The former's history suggests it has been driven sufficiently to keep components in good working order and has likely received its scheduled services.
A verified mileage history does more than just confirm a number; it tells a story. When that story aligns with a vehicle's age and expected usage, it becomes a powerful tool to justify a higher retail price and build the buyer confidence needed to close deals faster.
A professional mileage check UK dealers can trust requires more than a glance at the odometer; it demands context. This is where AutoProv’s trade vehicle intelligence provides a distinct advantage. By analysing a vehicle's MOT history, service records, and ownership patterns, our platform helps you determine if the mileage is not just accurate but also logical. This deeper insight allows you to confidently identify vehicles in the valuation sweet spot, avoiding the hidden risks of both over-worn and under-used stock. This understanding also feeds directly into your pricing strategy. For a deeper dive into valuation, you can learn more about how to calculate vehicle depreciation in our simple guide.
Identifying Mileage Discrepancy Red Flags
Understanding average mileage is one part of the equation; a professional trader’s expertise lies in spotting what a basic check will miss. Scrutinising MOT and service histories is a forensic skill, and identifying the tell-tale signs of a discrepancy is essential. This is where simple appraisal evolves into active risk assessment, protecting your business from acquiring problematic stock.
Anomalies in a vehicle's mileage history can range from simple clerical errors to deliberate odometer tampering—commonly known as 'clocking'. While some issues are benign, others are serious red flags that can destroy a vehicle's value and expose a dealership to significant legal and reputational damage.

Uncovering Non-Linear Mileage Progression
The most fundamental check is for logical, linear progression. A vehicle's mileage should always increase over time. Any deviation from this simple rule requires immediate and thorough investigation.
A classic red flag is a mileage reading that is lower than a previous entry in the MOT history. For example, if a car recorded 55,000 miles in its 2022 MOT but then shows 48,000 miles at its 2023 test, this is a major discrepancy. It could be a simple data entry mistake by the testing station, but it could also be a blatant sign of clocking.
This is precisely why a basic check is insufficient. The anomaly must be cross-referenced with service records and other historical data points to determine the cause. Ignoring such a clear inconsistency is a major risk. Our in-depth guide explains how to handle a car mileage discrepancy for UK motor traders in more detail.
Analysing Usage Gaps and Inconsistent Patterns
Another subtle but critical red flag is found in the pattern of mileage accumulation. Be wary of long periods of inactivity followed by a token increase just before the vehicle is offered for sale.
Consider this scenario:
- A vehicle consistently adds 8,000-10,000 miles per year for its first four years.
- It then records an increase of only 500 miles over the next 18 months.
- Finally, just before being traded, it adds another 200 miles in one week.
This pattern is highly suspicious. It could indicate the vehicle was off the road for an undisclosed reason, such as a major repair, or that the odometer was disconnected or tampered with during the period of inactivity. The small increase in mileage just before sale is often an attempt to make the history appear active and recent.
The story of a car's mileage is told in its rhythm and consistency. An abrupt change in that rhythm—be it a sudden drop, a long flatline, or a suspicious spike—is often the first signal of a deeper issue with the vehicle's provenance.
To help identify these issues quickly, here is a summary of common patterns that warrant further investigation.
Common Mileage Anomaly Red Flags for Dealers
Red Flag What It Looks Like Potential Implication Mileage Drop MOT history shows a lower reading than a previous entry (e.g., 60k miles in 2022, 55k in 2023). Could be a data entry error by the test centre, or it could be deliberate clocking. Long Inactivity The vehicle accrues very few miles (e.g., under 1,000) over a year or more. May indicate the vehicle was off the road for a major repair or was SORN. Sudden Spike An uncharacteristically large jump in mileage between two points (e.g., 20,000 miles in 6 months). Could suggest undisclosed use as a taxi, private hire, or fleet vehicle. Data Conflicts Service invoice mileage contradicts the MOT record from around the same time. Undermines the integrity of all records and indicates a data quality issue. Identifying these patterns allows you to move beyond the headline figure and understand the story behind the mileage, providing a much clearer picture of the vehicle's true history.
Cross-Referencing Data for Conflicts
A robust mileage check UK dealers can depend on must involve verifying information across multiple sources. A discrepancy is not only found within the MOT history; it can also appear when comparing MOT data against service records, auction listings, or previous keeper information.
For example, a main dealer service invoice might record the mileage at 62,000 miles in June, but the MOT from August of the same year shows only 58,000 miles. This conflict immediately undermines the integrity of the odometer reading and warrants a much deeper investigation into the vehicle's provenance.
This forensic approach is incredibly time-consuming when performed manually. Modern trade vehicle intelligence systems like AutoProv are designed to perform this heavy lifting. By analysing millions of data points from various sources, our platform flags these inconsistencies instantly, providing the critical risk signals you need at the point of decision. This protects you from the financial and legal consequences of acquiring a vehicle with a compromised history.
Using Provenance to Truly Understand Mileage
An odometer reading, on its own, is just a number. For a seasoned motor trade professional, its real value is only revealed when placed in the context of the vehicle's provenance. A deep analysis of a car’s ownership history is essential for validating whether its mileage is plausible or a significant red flag for underlying issues.
The story behind the number provides the critical context needed for a true risk assessment. This is where basic data checks fall short and why a full vehicle provenance analysis is indispensable. It represents the difference between simply buying a car and truly understanding it.
Connecting Keepers to Mileage
A vehicle's ownership history provides the framework for its mileage story. Key details like the number of previous keepers, the duration of each ownership period, and the type of owner all provide clues that either support or contradict the figure on the odometer.
Consider two identical five-year-old vehicles, both showing 20,000 miles.
- Vehicle A: Has had one private owner from new. The mileage is entirely credible, suggesting a low-use car likely used for local journeys.
- Vehicle B: Has had five different keepers in the same five-year period. The low mileage now appears highly suspicious, raising immediate questions about its history and integrity.
In the second scenario, the rapid ownership changes are a major warning sign. Why was the vehicle sold so frequently? Could it have been clocked at some point between sales? This is where a simple mileage check is insufficient; you need proper trade vehicle intelligence to connect the dots between ownership patterns and the recorded mileage.
The Influence of Owner Type
The type of previous keeper is another powerful indicator. A vehicle registered to a company will have a completely different expected mileage pattern compared to one registered to a private individual. A three-year-old ex-lease vehicle with 60,000 miles is perfectly normal, averaging 20,000 miles per year. The same mileage on a privately owned vehicle of the same age would be exceptionally high and require close scrutiny.
An odometer tells you how far a car has travelled, but its provenance tells you how it travelled. A low-mileage, multi-owner car is a far greater risk than a high-mileage, single-owner vehicle with a consistent history.
A robust used car history report must analyse these factors in conjunction. For instance, a history of very short ownership stints can be a sign of a persistent fault being passed from one unsuspecting owner to the next. In such a case, the low mileage is not a benefit; it is a symptom of a deeper problem. You can find out more by reading our ultimate guide to a car provenance report in the UK.
AutoProv is built to provide this layer of contextual analysis. Our platform does not just present raw data; it interprets the relationships between data points. By cross-referencing ownership timelines with MOT records and other historical data, it automatically flags the kind of inconsistencies that suggest higher risk. It builds a coherent narrative, confirming whether the mileage makes sense within the context of the vehicle's life. This allows you to move beyond simply checking the average mileage for cars and start making acquisition decisions based on genuine insight.
Frequently Asked Questions on Vehicle Mileage
To conclude, let's address some of the most common mileage questions that arise in the motor trade. This serves as a quick reference to reinforce key concepts, helping you make smarter, faster decisions when valuing and acquiring stock.
Is a vehicle with high motorway mileage a poor acquisition?
Not necessarily. In fact, a vehicle that has predominantly covered motorway miles can often be a better mechanical proposition than a low-mileage urban car. Sustained driving at a steady speed puts far less stress on the engine, gearbox, and drivetrain compared to constant stop-start journeys.
The key is verification. Does the service history show regular, timely maintenance consistent with that type of usage? A solid vehicle provenance check will help confirm if the ownership history fits the profile of a long-distance commuter. If the evidence aligns, it could be an excellent acquisition, despite the odometer reading.
How much does a mileage discrepancy affect a car's value?
A significant mileage discrepancy can be catastrophic for a vehicle's value. The financial impact can range from a 15% reduction for minor, explainable inconsistencies to 50% or more if there is evidence of deliberate odometer tampering ('clocking').
Beyond the immediate financial loss, knowingly or unknowingly retailing a vehicle with a fraudulent mileage history exposes your business to serious legal action and reputational damage. This is why a trusted mileage check UK dealers can depend on is not optional; it is a non-negotiable part of professional due diligence.
What is the most reliable method for verifying vehicle mileage?
The only truly reliable method is to cross-reference multiple data sources. A professional check should never rely on a single piece of information.
- Start with the official MOT history: This provides a government-backed timeline of recorded mileage readings.
- Scrutinise service records: Examine every service invoice and stamp. Do the dates and mileage progression align with the MOT data?
- Use advanced trade intelligence: This is the final layer of protection. A platform designed to assess motor trade risk can analyse historical data from numerous sources, automatically flagging patterns and anomalies that basic checks would miss. It provides the crucial depth of insight required before committing to a purchase.
At AutoProv, we provide the advanced vehicle intelligence UK motor traders need to move beyond simple data checks. Our platform is built to analyse provenance, identify hidden risks, and give you the contextual insight required to buy stock with genuine confidence. Discover how our dealer vehicle checks can protect your margins at https://autoprov.ai.
Frequently Asked Questions
AI-Generated Content Notice
This article was created with the assistance of artificial intelligence technology. While we strive for accuracy, the information provided should be considered for general informational purposes only and should not be relied upon as professional automotive, legal, or financial advice. We recommend verifying any information with qualified professionals or official sources before making important decisions. AutoProv accepts no liability for any consequences resulting from the use of this information.
From our AI insights
- Impact of Mileage on Car Valuation in the UK
Explore how mileage affects car valuations and learn practical tips for UK car buyers.
- How Mileage Checks Vary Across UK Vehicle Types
Explore how mileage checks differ for cars, vans, and motorcycles across the UK.
- Understanding Mileage Checks for Used Cars in the UK
Explore essential insights into conducting mileage checks for used cars in the UK.
Related Articles

Understanding Vehicle Mileage Importance
Discover the critical role of accurate mileage in vehicle provenance and how AutoProv can safeguard your purchase.

What Is the Average Annual Mileage in the UK?
Right now, the average annual mileage for a car in the UK hovers around 7,000 miles. For anyone in the motor trade, that number is more than just a statistic; it’s a vital benchmark that helps buyers, sellers, and insurers get a quick read on a car's usage and potential wear and tear.
Car Mileage Discrepancy Explained: A Guide for UK Motor Traders
When it comes to a car’s history, its mileage record should tell a simple, straightforward story: the number always goes up. A mileage discrepancy is what happens when that story suddenly does not make sense.
Published by AutoProv
Your trusted source for vehicle intelligence