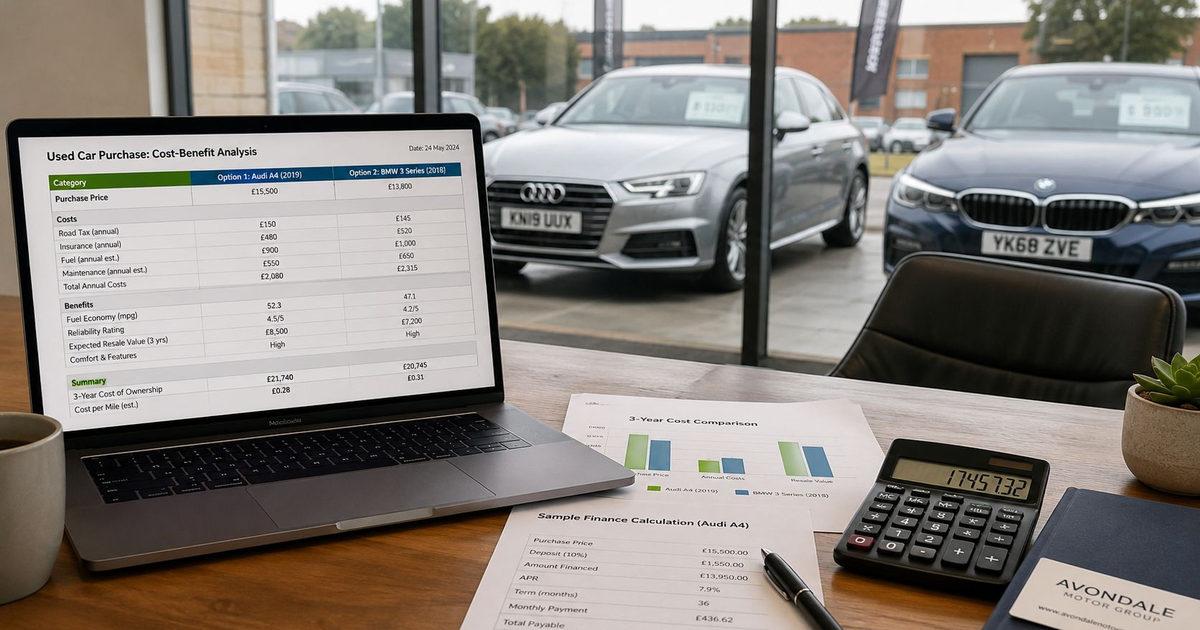
A used car can look like easy money at 9:10 on a Wednesday, then turn into a poor buy by lunchtime. The price seems sharp, the photos look tidy, and the stock manager wants movement. Then the paperwork shows a weird ownership pattern, the mileage trail feels thin, and the car is already costing you forecourt time before it's even collected.
That's where cost-benefit analysis earns its keep. In the UK, the Treasury's Green Book has long made this kind of appraisal the standard for public spending, and its 2020 update reaffirmed that projects should be judged by comparing benefits and costs over time using discounting and net present value. It also sets formal discount rates, including 3.5% for years 0 to 30, then lower rates for longer periods, which shows how seriously the UK treats the value of future cash flows and future outcomes (UK cost-benefit analysis and Green Book context). That same discipline works on a single unit of stock when the decision isn't really “cheap or expensive”, but “what does this car cost me across the full lifecycle, and what does it return after time, risk, and rework?”
Table of Contents
- The Wednesday Morning Stock Decision
- What Cost-Benefit Analysis Actually Means for a Dealer
- Scope the deal before you price it
- Monetise what usually gets left out
- Compare like for like
- The Cost Categories That Move the Decision
- Direct costs are the visible ones
- Indirect costs are usually where margin leaks
- Contingent costs are the ones that punish optimism
- Discounting, Benefit-Cost Ratios, and a Worked Example
- How the maths works in a dealer setting
- A worked comparison
- Why the same method works in public appraisal
- Risk-Adjusted Scenarios and Why Point Estimates Lie
- Build three cases, not one
- Stress the variables that dealers actually feel
- A Practical Decision Template for Trade Buyers
- Use trigger points, not hope
- A quick trade example
- A simple dealer checklist
- Common Pitfalls That Undermine Dealer Cost-Benefit Analysis
The Wednesday Morning Stock Decision
A wholesale list lands, and one unit stands out. It is priced below the obvious retail alternatives, the trim looks saleable, and the image set does not show anything dramatic. Then the ownership trail looks shorter than expected, or the mileage history does not sit neatly, and the question shifts from whether you can buy it to how much hidden work you are buying with it.
That is the dealer version of cost-benefit analysis. It is not a boardroom exercise or an academic chart. It is a disciplined way to compare what you pay now against what the vehicle is likely to cost you before it turns into cash. The spreadsheet matters because it stops a sharp-looking price from hiding a weak unit.
Practical rule: if the car needs explanation before it needs valuation, the explanation belongs in the model.
The UK appraisal tradition matters here because it is built around comparing outcomes over time, not just looking at today's headline number. The Treasury framework uses that logic in public spending, and transport appraisal has long relied on quantified benefits and costs rather than instinct alone. That discipline shows up in the HS2 appraisal retrospective, where the central benefit-cost ratio for the full Y-shaped network was about 2.0, meaning estimated benefits were roughly twice the costs under the central scenario (HS2 appraisal retrospective). The project is different, but the method is the same. If the numbers do not survive comparison, the decision does not either.
For a dealer, the risk is not only overpaying at purchase. A car that looks cheap can become the most expensive unit on the forecourt if it absorbs reconditioning time, pulls the team into disputes, or sits too long before sale. That is why a proper vehicle history check UK workflow has to sit inside a wider motor trade risk review, not replace it.
The dealer question is straightforward. What is the purchase price, what is the downstream cost, what is the likely sale value, and what happens if the unit behaves worse than expected?
What Cost-Benefit Analysis Actually Means for a Dealer
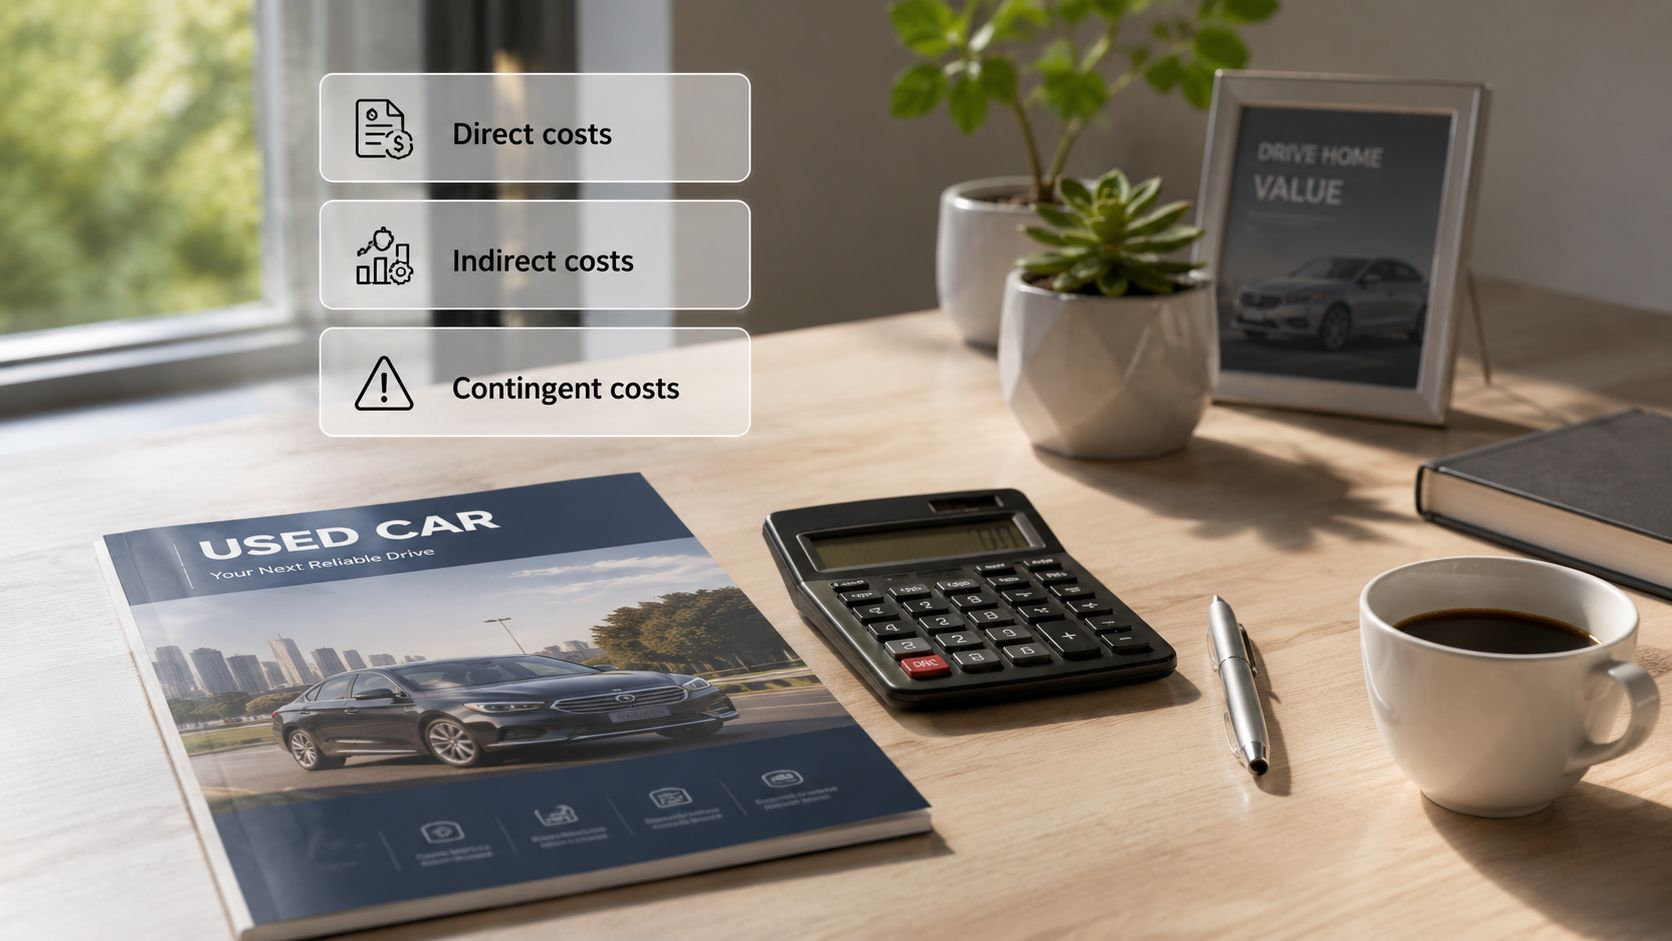
At dealer level, cost-benefit analysis means comparing the full cost stack on a vehicle with the value it can realistically produce for the business. The OECD describes the basic rule as accepting a project when benefits outweigh costs, and the handbook approach frames the method as measuring benefits and costs as far as possible in money units (OECD environment CBA handbook). That is close to what experienced traders already do on instinct, but the formal version is better because it forces the same test on every unit.
A Wednesday morning stock sheet shows why that matters. One car can look fine on margin if you only read the hammer price and the expected retail price. The model changes once you add prep, time, and the chance that the unit does not behave the way the plan assumes.
Scope the deal before you price it
Start by defining the decision clearly. Is this an auction buy, a part-ex, a trade-source car, or a stock refresh decision? The World Bank's four-step method fits that workflow well. Identify the costs and benefits, quantify them, value them, then compare them to judge whether the proposal is worthwhile (World Bank introduction to CBA).
That sounds basic, but it stops buyers from mixing different decisions together. A car that is acceptable as a fast retail turn may fail as a straight margin play if the stock profile is wrong. The question is whether the deal belongs on your pitch, not whether it looks neat in isolation.
Monetise what usually gets left out
A purchase-price-only view misses the costs that move dealer profit. A vehicle that needs extra prep, creates a comeback, or sits on the forecourt too long is not just a bit harder, it is a different economic decision. The HBS guidance on appraisal is blunt that indirect and intangible items such as time, compliance burden, and opportunity cost need to be monetised if you do not want to overstate net benefit (HBS cost-benefit guidance).
That is where vehicle acquisition costing guidance becomes useful in practice. It forces the buyer to separate the visible entry price from the acquisition cost, which is the number that matters once transport, prep, and management time are in the frame.
Compare like for like
The aim is not to produce a tidy spreadsheet. It is to compare alternatives on the same basis, using expected present value rather than gut feel. The Australian Office of Impact Analysis sets out the same logic through selecting options, monetising impacts, discounting future costs and benefits, and computing net present value (Australian Office of Impact Analysis CBA process).
A dealer might look at two otherwise similar cars, one from auction and one from a cleaner trade source. The auction unit could be lower on entry price, but once you include prep, delays, and the chance of a comeback, the cheaper car can fail on a full lifecycle view.
The useful test is simple. If the unit only works under an ideal sale path, it is not a strong buy.
The Cost Categories That Move the Decision
A deal can look strong at the hammer, then turn weak once the stock cost is laid out. The first mistake in dealer cost-benefit analysis is treating cost as the hammer price. The second is pretending the rest is too messy to model. In practice, the decision usually breaks into three layers, direct cost, indirect cost, and contingent cost.
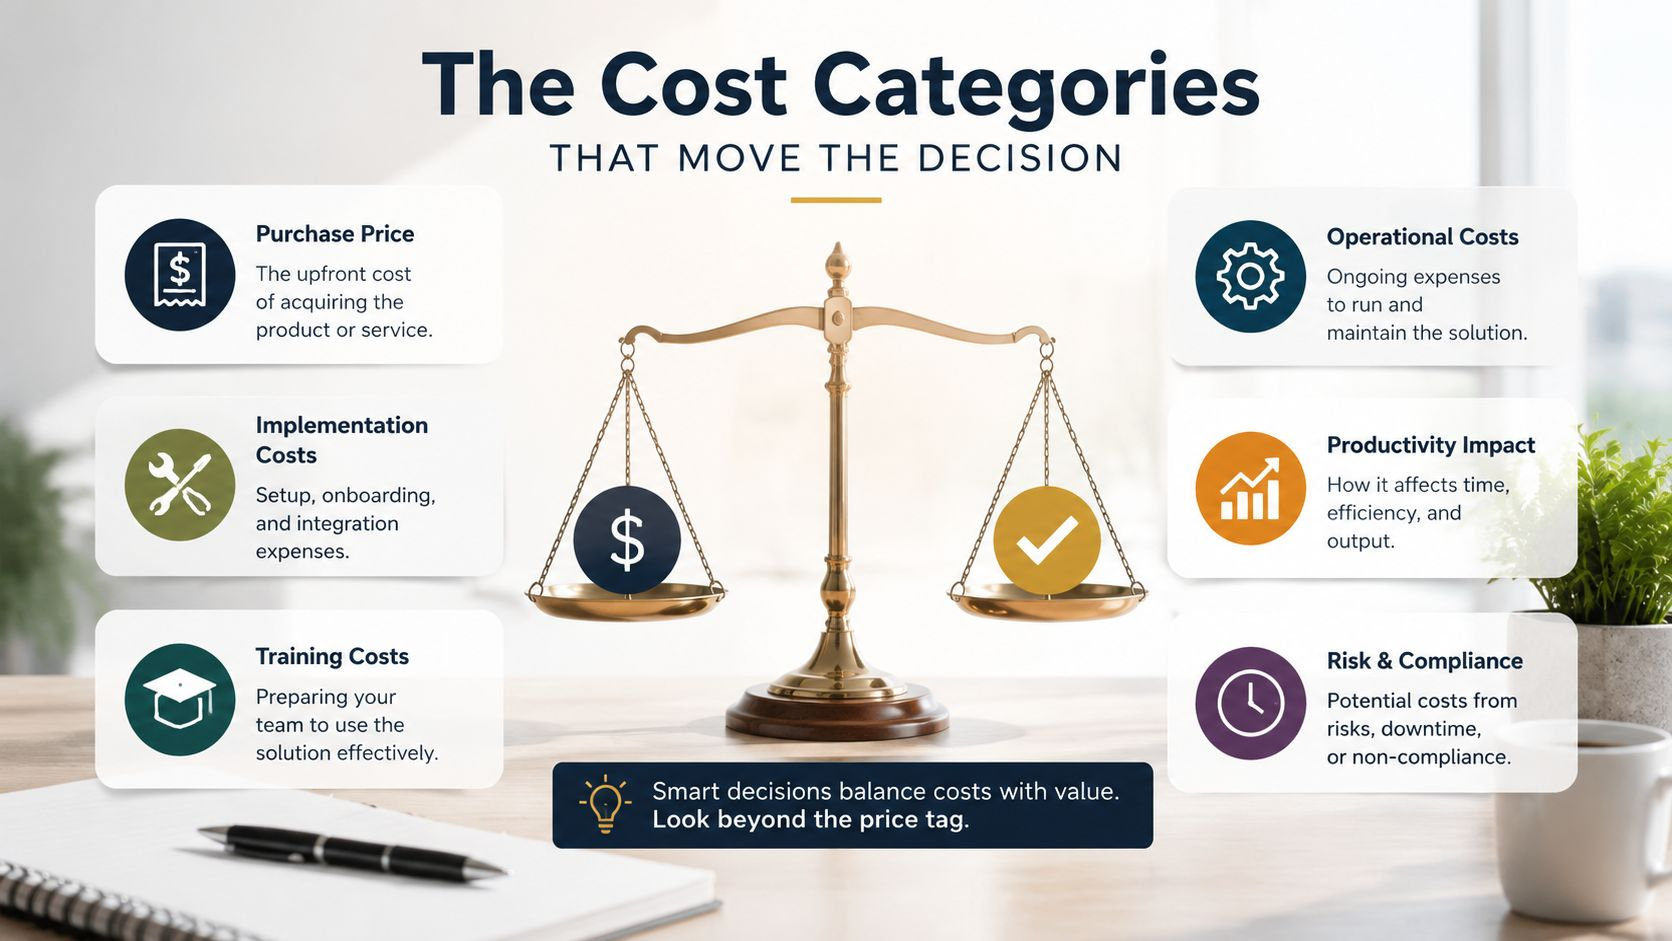
Direct costs are the visible ones
These are the line items every buyer expects to see, purchase price, auction fees, transport, recon, valeting, tyres, and any mechanical work already identified. They are easy to capture, which is exactly why they get treated as if they were the full picture.
The right question is whether those costs are complete. If the car needs a clutch, a service, a wheel refurb, and collection from a distant site, the acquisition price is only the starting point.
Indirect costs are usually where margin leaks
Indirect cost is the management drag that never appears on the invoice. Time spent chasing a history query, handling admin, coordinating bodywork, or parking a unit that will not retail immediately all belong in the model. The HBS guidance warns against ignoring time, compliance burden, and opportunity cost because they change the outcome (HBS cost-benefit guidance).
For dealers, that means stock time, staff time, and the cost of a car occupying a bay when another cleaner unit could have turned faster. If your team spends half a day unpicking a provenance issue, that is not background noise. It is a cost.
Contingent costs are the ones that punish optimism
Vehicle provenance matters. Short-term ownership, mileage anomalies, rapid resale patterns, and inconsistent data can point to risk even when the car looks tidy in photos. Those signals do not always mean a bad car, but they do mean the downside gets wider.
A used car history report that only says “clear” can miss the commercial issue, because a car with no obvious blocker may still carry a higher chance of reconditioning surprises, comeback handling, or slower retail conversion. A serious dealer vehicle checks process has to turn those risk signals into money, not just labels. hidden costs of buying without provenance checks
A unit with a clean front-end story and a messy back-end trail often costs more than the spreadsheet first shows.
For a working stock worksheet, capture at least these buckets:
- Direct acquisition costs, purchase, fees, logistics, and known prep.
- Indirect operating costs, admin time, storage, and sales delay.
- Contingent exposure, comeback risk, dispute handling, and extra recon.
- Holding cost, the cash tied up while the car sits unsold.
That last line matters because even if the unit eventually sells well, the delay changes the economics. A cheap car that stands around is still a weak buy.
Discounting, Benefit-Cost Ratios, and a Worked Example
A car can look profitable on the day you buy it and still be a poor stock decision once time, prep, and delay are counted. That is why formal appraisal does not stop at adding costs and benefits together. It discounts future amounts back to present value, because cash next month is worth less than cash today, and cash six weeks from now is not the same as cash in hand on the Wednesday you bid. The UK Green Book's approach keeps that logic, with 3.5% used for years 0 to 30, then lower rates beyond that in later periods (UK Green Book discounting approach).
How the maths works in a dealer setting
The rule is simple enough to use on a worksheet. Estimate the present value of the benefits, estimate the present value of the costs, then compare them with a benefit-cost ratio. If the ratio is above 1, the benefits exceed the costs. If it is below 1, the unit is not earning its keep on the assumptions you have put in.
For motor trade stock, “benefit” means expected gross margin after recon, not the headline retail sticker. “Cost” includes the purchase price, prep, holding, and expected downside. That is the difference between a car that looks strong in a deal sheet and one that turns cash once it leaves the forecourt.
Discounting matters because time has a cost even when the invoice does not show it. A car that sells later ties up capital, takes up space, and keeps the buyer exposed to movement in the market. A simple way to estimate the time element is to treat the standing period like an economic cost and fold it into the stock math, the same way you would if you were working through vehicle depreciation in plain terms.
A worked comparison
Sample Cost-Benefit Calculation for a Used Vehicle Purchase Vehicle A (Auction) Vehicle B (Trade Source) Purchase price Lower entry price Higher entry price Reconditioning spend Higher expected spend Lower expected spend Holding time Longer expected stand time Shorter expected stand time Warranty reserve Higher reserve Lower reserve Expected retail margin Strong on paper Slightly lower headline margin Discounted net outcome Can slip when delays and extras are included Often steadier when the whole lifecycle is counted The table is basic on purpose. Dealers do not need pretend precision, they need a clean way to compare a cheap unit that may soak up money later with a dearer unit that turns faster and keeps the book tighter. If the auction car only wins before recon and time are counted, it is not really winning.
A worked example like this also stops people from confusing a wide gross margin with a good buy. The gross is only part of the answer. A unit can show a healthy margin on paper and still come out weak once you account for delay, prep, and the cash tied up while it sits.
Why the same method works in public appraisal
The same logic sits behind wider public appraisal, including the benefit-cost ratio approach used in government work. The HS2 appraisal retrospective is a good example of that style of analysis, because it treats different effects as part of one monetised case instead of leaving them in separate silos (HS2 appraisal retrospective).
That matters for a single-vehicle decision because the dealer's question is the same in smaller form. Is this car worth the capital, effort, and time once you turn the future cash into present value, then measure the whole deal as one unit? The answer is usually clearer when you compare the ratio, not just the headline margin.
Risk-Adjusted Scenarios and Why Point Estimates Lie
A single number can make a bad unit look fine. That's why point estimates are dangerous in motor trade risk work, especially where a mileage check UK result, ownership pattern, or retail demand assumption could shift the outcome after you've already committed. Standard appraisal frameworks call for sensitivity testing because result quality depends heavily on future performance, demand, and timing assumptions (Kentucky Transportation Center report).
Build three cases, not one
Use a base case, a downside case, and a severe-downside case. Change the assumptions that matter, not cosmetic ones. Reconditioning overspend, extra days on forecourt, slower retail demand, or a mileage anomaly surfacing after purchase can all move the result in a way that a flat forecast won't show.
A positive net present value isn't always enough if the downside band is ugly. A unit that performs acceptably in the base case but becomes awkward the moment one assumption breaks is a poor operational choice, even if the centre line looks healthy.
Stress the variables that dealers actually feel
The most useful scenario tests are the ones tied to cash and time. A car that needs more prep than expected, holds longer than expected, or sells only after a price reduction behaves very differently from a tidy fast-turn unit. The same is true if a history flag triggers extra caution from retail buyers, because hesitation at the point of sale turns into holding cost.
Dealer rule: if one extra week on site changes your answer, the deal was never robust enough.
The exact benefit-cost ratios will vary by unit, but the logic should stay consistent. A headline ratio above 1 in the base case does not matter if the severe-downside case turns the deal into a drag. In trade terms, that's the difference between a stock decision and a gamble.
inventory risk assessment for stock buying
A Practical Decision Template for Trade Buyers
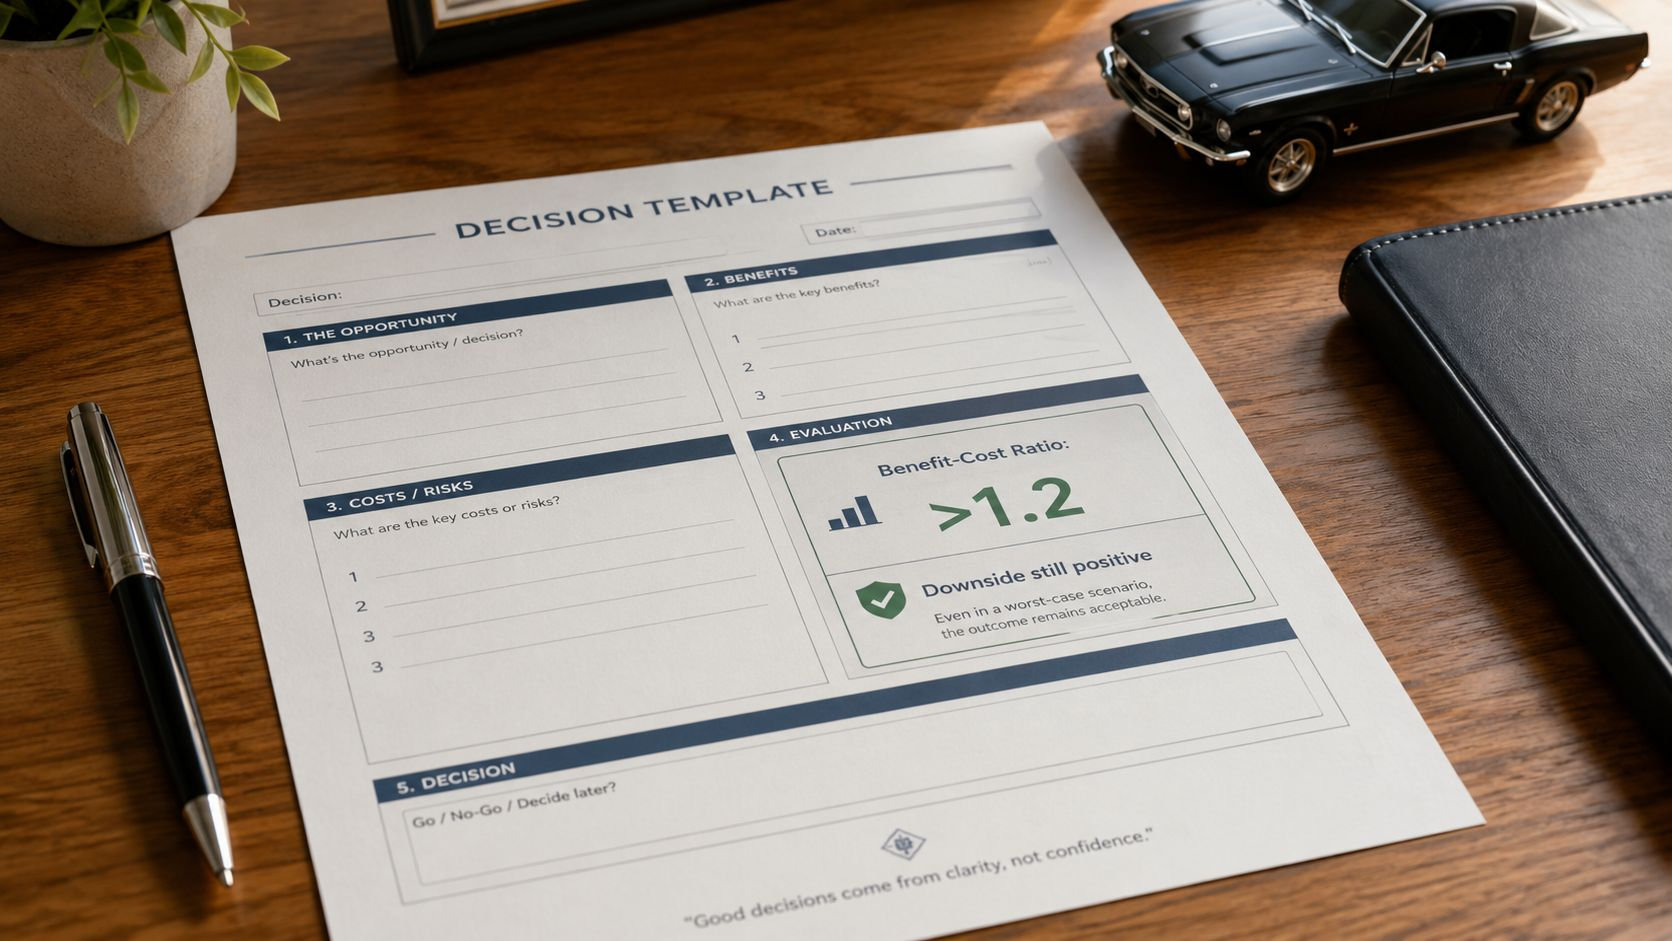
For a working decision sheet, set thresholds before you start looking at the car. That stops enthusiasm from rewriting the numbers after the fact. A deal with a benefit-cost ratio above 1.2 and a downside case still above 1 is a buy. Between 1.0 and 1.2, buy only if the price gives you room. Below 1.0, pass.
Use trigger points, not hope
Some signals should send the deal straight back to renegotiation. Short-term ownership, mileage inconsistencies, or wholesale-grade provenance concerns change the commercial risk before you've even inspected the car properly. If the signals stack up, the car needs a better price or a different buyer.
A useful way to sanity-check the maths is to compare the expected return on stock against a separate break-even threshold. A practical break even ROAS calculator is built for marketing spend rather than vehicle buying, but the thinking is similar, if your expected return can't clear the floor, the campaign or the car doesn't deserve capital.
A quick trade example
Suppose a unit looks profitable at list price, but the history trail suggests extra recon and slower retail response. If the revised model still holds above the buy threshold after adding those costs, the deal can go ahead. If it only works when you ignore them, the vehicle is too tight for stock.
A simple dealer checklist
- Check the base economics first, purchase, recon, holding, and expected retail.
- Test the downside next, slower sale, extra rework, or a weaker exit price.
- Escalate any provenance warning, because risk signals should affect price, not just admin.
- Compare against your floor, not against hope or the last car you sold.
- Keep the same method every time, so decisions stay comparable across stock.
Better trade vehicle intelligence pays off. The more accurate the input, the less likely you are to buy a car that only works on paper. Good provenance data doesn't make the decision for you, but it does stop weak assumptions from sneaking into the model.
Common Pitfalls That Undermine Dealer Cost-Benefit Analysis
The biggest error is pretending benefits are certain while uncertainty only applies to costs. That gives the spreadsheet a false sense of confidence and usually flatters the wrong car. A proper appraisal treats both upside and downside as conditional, then tests what happens when reality drifts from the centre line.
The second error is ignoring downtime. In dealer terms, downtime isn't a nuisance, it's a cost per unit of asset availability, and it needs to sit in the model beside recon and purchase price. A car that stands too long can look fine on a margin sheet and still be weak on return on capital.
The third error is stopping at the acquisition price. That's where a lot of vehicle history check UK activity ends, and it's not enough for serious buying. The point isn't just to know whether a vehicle is likely saleable, it's to know what it will cost to make it saleable, keep it saleable, and defend the sale if questions arise.
The best spreadsheet in the world still fails if the provenance input is shallow.
There's also a more subtle problem, assuming a positive net present value automatically means a good operational decision. It doesn't. A car can be theoretically profitable and still be the wrong stock choice if the downside variance is ugly, the stand time is too long, or the risk signals are too messy for the margin it offers.
That's why stronger vehicle provenance data matters at the point of purchase. Better inputs improve the quality of the cost and benefit numbers, which improves the decision. In the motor trade, that means less guessing, fewer unpleasant surprises, and a cleaner stock book.
A strong dealer cost-benefit analysis doesn't need more theory, it needs cleaner inputs and a harder view of downside. If you want to tighten your stock valuation process, start by checking how much of your current worksheet is based on purchase price alone, then add the provenance and risk layers that change the actual answer. A good next step is to review how AutoProv fits into that buying workflow, then test your next borderline unit against the same decision template before you commit capital.
Frequently Asked Questions
AI-Generated Content Notice
This article was created with the assistance of artificial intelligence technology. While we strive for accuracy, the information provided should be considered for general informational purposes only and should not be relied upon as professional automotive, legal, or financial advice. We recommend verifying any information with qualified professionals or official sources before making important decisions. AutoProv accepts no liability for any consequences resulting from the use of this information.
From our AI insights
- Advanced Mileage Verification for UK Dealers
Explore innovative mileage verification tactics for UK car dealers to mitigate risks and enhance negotiations.
- Harnessing Real-Time Data in UK Motor Trading
Explore how real-time data aids UK traders in identifying vehicle risks swiftly.
- Predictive Insights: Using DVLA Data for Stock Risk Analysis
Explore how DVLA data transforms into predictive insights for UK car dealers managing stock risk.
Related Articles

Navigating the UK Used Car Market
Explore the latest trends in the UK used car market and how AutoProv can reveal true vehicle values.

Understanding Market Insights for Vehicle Pricing
Learn how market insights can guide UK traders in setting the right vehicle prices.

7 Best Second Hand Cars to Buy UK: A 2025 Guide
The search for the best second hand cars to buy in the UK can feel like navigating a maze of private listings, vast online showrooms, and conflicting advice. With prices fluctuating and new models constantly entering the used market, how do you identify a reliable, fairly-priced vehicle that truly suits your needs? This guide is designed to cut through the noise and provide clear, actionable insights for your next purchase.
Published by AutoProv
Your trusted source for vehicle intelligence