
You're on the forecourt with three cars that should have turned by now, one buyer on the phone asking awkward questions about a mileage gap, and a spreadsheet that says stock is “fine” because the gross margin looked decent last month. That's the trap. Stock turnover rate only helps if you read it as a buying and disposal signal, not as a vanity number, and in the UK motor trade it sits right next to vehicle history check UK data, vehicle provenance, and every other point-of-decision check that stops good cash being tied up in bad metal.
Table of Contents
- What Stock Turnover Rate Means for UK Car Dealers
- Inventory turnover and share turnover are not the same thing
- What dealers should care about instead
- How to Calculate Stock Turnover Rate with Worked Examples
- Step one, calculate average inventory
- Step two, divide COGS by average inventory
- Step three, turn the ratio into days in stock
- Industry Benchmarks and Context for the Motor Trade
- Benchmarks only work when they match the business model
- What to compare against in practice
- Why Faster Turnover Is Not Always Better
- The speed and margin trade-off is real
- When a lower rate makes business sense
- Use age and margin together
- How Vehicle Provenance Intelligence Supports Smarter Turnover
- The problem starts at acquisition
- Provenance data protects both turnover and reputation
- Actionable Strategies to Improve Stock Turnover
- Use age triggers, not gut feel
- Match the stock mix to local demand
- Tighten acquisition criteria before the car lands
- Clear aged stock with a plan
- Building a Turnover-Focused Stock Management Process
What Stock Turnover Rate Means for UK Car Dealers
A dealer can look at a forecourt and think the problem is slow advertising, when the issue is that the stock mix is wrong. That happens when a team treats stock turnover rate like a generic finance metric instead of a dealership control measure. In motor retail, it's about how often inventory is sold and replaced over a period, and it only makes sense when you connect it to holding costs, reconditioning spend, finance pressure, and the time money stays tied up in each unit.
Inventory turnover and share turnover are not the same thing
A lot of search results blur inventory turnover and share turnover, which confuses the question before the reader even gets to the answer. For a dealer, inventory turnover is a stock-management KPI, usually expressed through COGS ÷ Average Inventory. By contrast, share turnover ratio is a market-liquidity measure, typically trading volume ÷ average shares outstanding, and the World Bank's market data definition of turnover ratio uses value traded divided by market capitalisation (World Bank metadata glossary).
That distinction matters because the decision changes. In the motor trade, low turnover means capital is sitting in metal, storage, depreciation, and ageing risk. In listed equities, turnover is about how easily a market absorbs trading, and the Financial Conduct Authority's 2024 work on market abuse risk still matters because thinly traded stocks can be moved with relatively small volumes, while highly traded names usually have stronger liquidity.
What dealers should care about instead
A seasoned stock controller watches turnover alongside the rest of the file, not in isolation. A unit can be “turning” and still be a bad buy if the history is murky, the mileage pattern doesn't stack up, or the model line only sold because the price was cut too hard.
Practical rule: if the car is easy to buy, slow to verify, and awkward to retail, the turnover number will usually tell you the truth before the customer does.
That's why turnover is best treated as a decision aid. It tells you where cash is trapped, which stock ages out of the sweet spot, and which acquisition channels keep feeding you the same problem cars. For a dealer team, the better question isn't “what's our turnover rate”, it's “which stock classes are dragging it down, and why?”
If you're mapping that back to operational controls, the discipline sits naturally beside inventory risk management, because the same stock that turns slowly is often the stock that was weak at source. For a practitioner's view of the data trails that matter, a useful reference is Flaresolverr Cloudflare bypass guide, since many trade teams end up comparing sources, portals, and online listings as part of the same acquisition workflow.
How to Calculate Stock Turnover Rate with Worked Examples
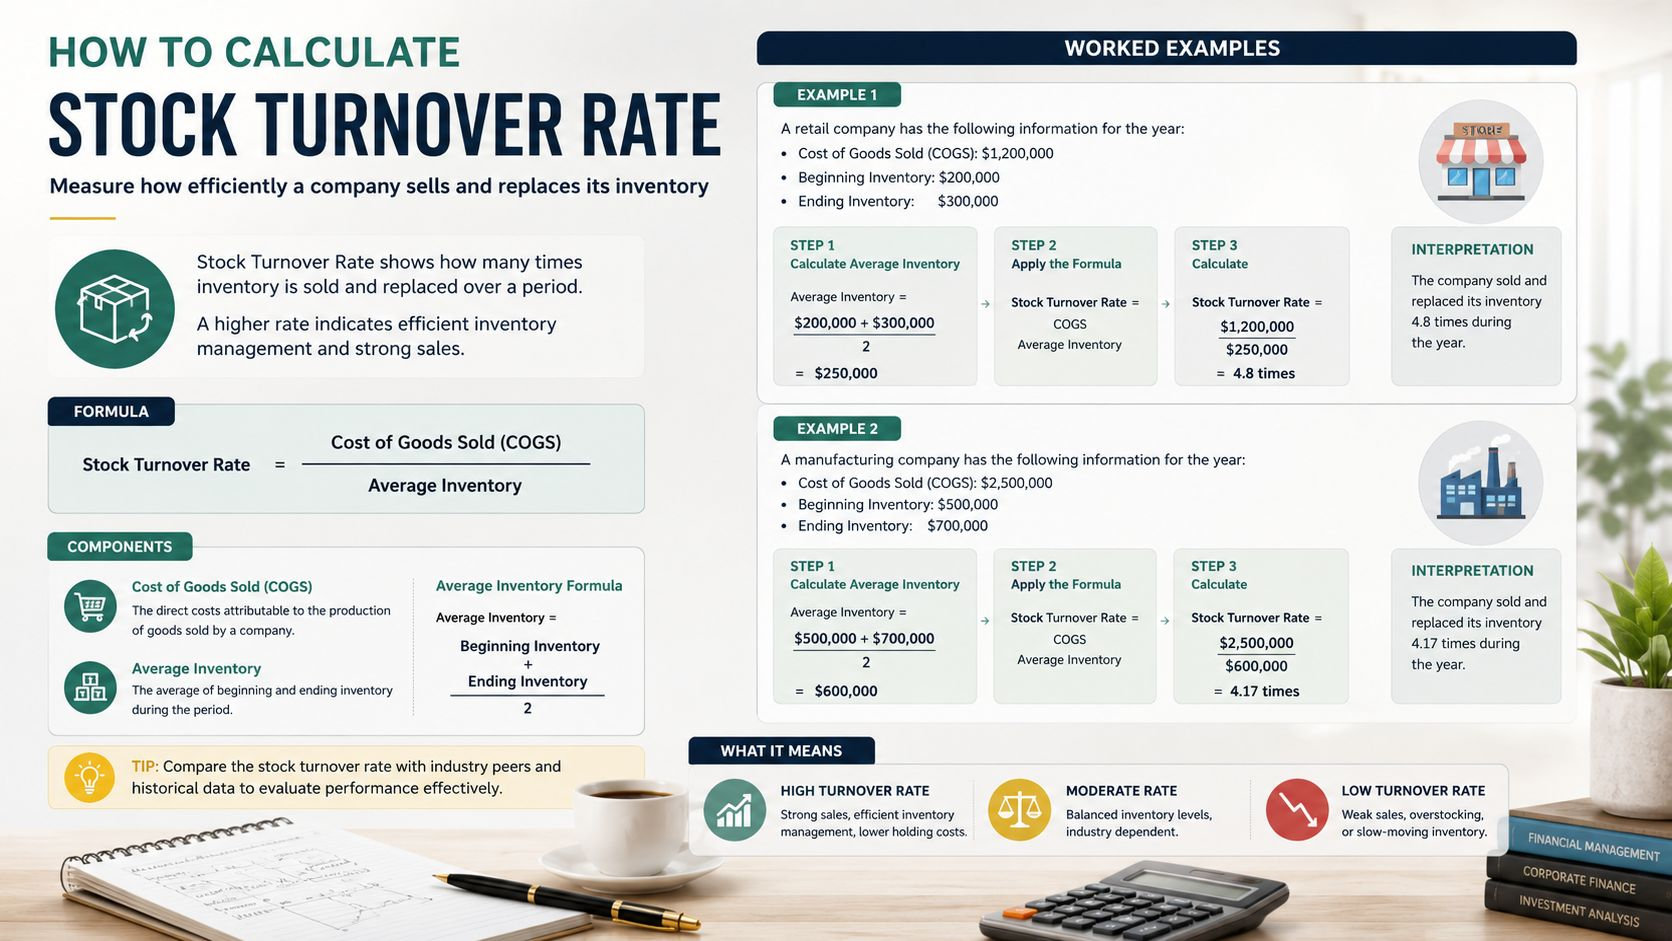
The formula is simple, but dealerships still get it wrong because they use sales revenue instead of cost. The standard measure is COGS ÷ Average Inventory, and several guidance sources stress that it should be based on cost, not sales price (Wall Street Prep, Interlake Mecalux). In the motor trade, that matters because retail price carries margin, discounting, and finance structure, while stock turnover is trying to show how fast the underlying inventory itself is moving.
Step one, calculate average inventory
Average inventory is usually the opening stock plus closing stock, divided by two. That gives you a steadier picture than using one month-end snapshot, which can be distorted by a delivery day, a clearance event, or a late purchase.
If a dealer starts the year with £70,000 in stock and ends with £90,000, the average inventory is £80,000. That number is the base for the turnover ratio, not the retail value of the forecourt.
Step two, divide COGS by average inventory
Using the verified working formula, a hypothetical independent dealer with £500,000 in annual COGS and £80,000 average inventory has a stock turnover rate of 6.25. In other words, the stock base is replaced a little more than six times over the year.
Step three, turn the ratio into days in stock
A practical way to read the figure is 365 ÷ stock turnover ratio (Univest). On the worked example above, 365 divided by 6.25 gives roughly 58 days in inventory. That's a far more usable number for a dealer than a raw ratio, because the team can compare it with ageing bands, remarketing windows, and the point where margin starts to erode.
A second example helps. If COGS stays the same but average inventory rises to £100,000, turnover drops to 5. The stock is still moving, but it's sitting longer, which normally means more capital tied up and more pressure on gross profit to absorb holding costs.
Useful habit: calculate turnover by stock class, not just for the whole site. A prestige line, a run-of-the-mill hatchback range, and a retail part-ex programme do not behave the same way, so one blended figure can hide the real problem.
If you want a cleaner way to move from ratio to operating decisions, the method pairs well with days to sell metrics using market data choose stock, because both numbers help you decide when a car should stay, reprice, or go.
Industry Benchmarks and Context for the Motor Trade
There isn't a single healthy turnover number that fits every dealer. A volume operation selling common UK family cars will normally behave very differently from a specialist holding niche models, and the right answer changes again once you factor in seasonality, local demand, and the age profile of the stock.
Benchmarks only work when they match the business model
The simplest way to think about it is this. Faster-moving stock is not automatically better stock, and slower stock is not automatically bad stock. The dealer type, pricing position, and reconditioning cycle all affect the number, which is why a benchmark without context can mislead the buying team.
Dealer Type Typical Annual Turnover Days in Stock Key Considerations Volume independent dealer Qualitatively high Qualitatively lower Popular models, fast pricing response, tighter merchandising Prestige specialist Qualitatively lower Qualitatively higher Niche stock, longer decision cycles, margin can justify patience Trade wholesaler Qualitatively high Qualitatively lower Fast acquisition and disposal, thinner holding window Mixed retail site Mid-range Mid-range Balance of fast lines and slower premium units Low-volume specialist Qualitatively lower Qualitatively higher Scarcer stock, more inspection time, stronger provenance checks
What to compare against in practice
The best comparison is your own history, broken out by vehicle segment, source channel, and age band. That's where market insight tools earn their keep, because they help you see whether the stock that lingers is the same stock that keeps missing your target audience. If the same body style, mileage band, or fuel type keeps drifting past your preferred age profile, the buying criteria probably need tightening.
Dealer takeaway: compare turnover against gross margin and stock age together. A high-turnover unit that only sold because it was overpriced at entry and then heavily discounted is not the same thing as a well-bought car that never overstayed.
Market conditions matter too. The World Bank and FRED-style turnover series show that annual market turnover ratios can swing materially across cycles, and the U.S. series, for example, moved from 19.5% in 1975 to 68.4% in 2019 and 38.3% in 2020 (FRED). That doesn't give a dealer a direct retail target, but it does show how sharply turnover can change when conditions move.
For UK dealers, that's the point of using vehicle valuations market insights alongside the turnover file. If your stock is priced to sit, or if acquisition values ignore local demand, the turnover figure will tell you after the money has already been tied up.
Why Faster Turnover Is Not Always Better
A forecourt can look efficient while giving away profit. That's why chasing speed on its own is risky. If the only goal is to move stock faster, teams can end up discounting too early, buying thinner ranges, or understocking the cars that make the money.
The speed and margin trade-off is real
Turnover can be inflated by selling too cheaply, trimming the stock profile until the site looks lean, or pushing out desirable stock before demand peaks. None of those behaviours necessarily improve the business. They can create a cleaner spreadsheet while leaving the site short of the right vehicles and weaker on gross margin.
That problem shows up most clearly when a dealer celebrates a “good” month but ignores what it cost to get there. A car that turns quickly because it was bought badly, reconned heavily, and priced defensively is not a model to copy. It's a warning that the system rewarded movement, not quality.
When a lower rate makes business sense
Some stock should sit longer because the margin justifies the wait. Rare specification cars, harder-to-source colours, or niche trims can be rational to hold if the team knows the local buyer profile and the stock is well documented. The key is that the delay is deliberate, not accidental.
- Hold longer when the unit is scarce: rare spec and stronger retail appeal can justify patience.
- Move faster when age is the enemy: cars with rising holding costs, recon creep, or weak enquiry need a firm disposal plan.
- Avoid false efficiency: cutting the range too hard can make the site look sharper while shrinking the chance of a profitable sale.
Use age and margin together
The most useful check is whether a slower turn is still producing the right gross return for the time and cash involved. If a unit sits longer but keeps margin intact, that may be a valid strategy. If it sits longer and keeps getting repriced, it's probably dead money.
High turnover is only good when the stock still has quality, the gross survives, and the buyer pool remains healthy.
That is why a cost-benefit view matters. The discipline behind cost benefit analysis applies cleanly here, because the trade-off is never just “faster or slower”. It's speed, margin, age, and capital, all pulling on the same forecourt decision.
How Vehicle Provenance Intelligence Supports Smarter Turnover
A car with hidden history issues rarely stays easy stock for long. It may start out as a reasonable buy, but once the file shows awkward ownership patterns, mileage anomalies, or other risk signals, the unit often turns into a slow mover because the team has to defend it harder at point of sale.

The problem starts at acquisition
Basic checks are useful, but they don't always answer the trade question. Dealers need to know whether a vehicle's background makes it easier or harder to retail, and that means looking at the story behind the registration, not just the presence of a pass/fail result. The useful checks are the ones that help the buyer spot the stock most likely to age badly.
Short-term ownership, rapid resale patterns, mileage inconsistencies, and insurance-related events are the kinds of signals that can affect saleability even when the car looks tidy on the forecourt. A used car history report that only confirms the obvious isn't enough when the risk sits in context. That's why trade vehicle intelligence is most valuable at the point where the buyer decides whether to commit capital.
Provenance data protects both turnover and reputation
A clean file doesn't guarantee a fast sale, but it makes the selling job easier. Sales staff spend less time explaining the car, buyers ask fewer defensive questions, and the business reduces the chance of post-sale friction. That combination usually helps days in stock fall in a natural way, because the unit is easier to price, easier to present, and easier to stand behind.
It also helps with valuation discipline. A car with awkward provenance should usually be priced differently from a similar car with a clear, consistent history, because the market will treat the risk differently whether the dealership does or not. Good provenance intelligence stops the team overpaying for a car that will later need to be pushed out at a discount.
Practical rule: if the history file creates hesitation in the buying office, expect the same hesitation at the retail desk.
That's where a trade-focused platform earns its place. AutoProv's angle is relevant here because the business problem is not just “is there a flag”, but “what does this pattern mean for saleability, valuation, and dispute risk?” For a fuller breakdown of the document types and risk layers that matter, see the ultimate guide to a car provenance report UK.
Actionable Strategies to Improve Stock Turnover
The fastest way to improve turnover is not a blanket discount. It's a tighter buying standard, a clearer ageing policy, and a pricing routine that forces decisions before stock becomes stale. Dealers who do this well protect margin while improving the speed of cash conversion.
Use age triggers, not gut feel
Set repricing and review points by days in stock, then stick to them. A car that hasn't generated serious interest by the agreed point usually needs a visible decision, either a price adjustment, a photo refresh, a retail channel change, or a wholesale exit. Without that discipline, slow stock absorbs attention while better units wait.
Match the stock mix to local demand
A site selling into a specific catchment should buy the cars that the area absorbs. That means watching body style, fuel type, gearbox preference, and price band by local response, not by what looked easy to source at auction. Poor mix is one of the quickest ways to trap cash in stock that nobody is urgently looking for.
Tighten acquisition criteria before the car lands
The best turnover improvement often happens before the car reaches the forecourt. If a vehicle has a messy background, inconsistent mileage trail, or weak market appeal, the better decision may be not to buy it at all. That saves recon time, avoids awkward sales conversations, and keeps the stock profile cleaner.
Clear aged stock with a plan
Aged stock should have a separate disposal routine, not just a lower price slapped on at the last moment. Use wholesale channels, trade exchanges, and focused retail campaigns where appropriate, but don't let the same units sit because the team hopes the market will improve on its own.
- Reprice early: make the first move before the car gets stale.
- Reduce recon waste: don't keep spending on stock that's already past its retail window.
- Protect choice: keep enough depth in the best-selling lines so the site still feels open for business.
- Use staff reviews: track which units staff avoid, because those are often the hardest to retail for a reason.
The customer experience still matters. Teams that handle walkarounds, responses, and follow-up well usually move stock more cleanly than teams that rely on price cuts alone, which is why good mastering retail customer service thinking still belongs in a used-car sales environment.
Building a Turnover-Focused Stock Management Process
The best stock rooms don't run on one dashboard. They run on a routine. Turnover reporting should sit inside buying, pricing, and disposal meetings so the team sees which cars are moving, which ones are stuck, and which acquisition choices keep creating the same problem.
A sensible process is simple. Review turnover by stock class, watch ageing bands closely, and tie every slow mover to a decision. If the cause is price, fix the price. If the cause is product mix, fix the buying. If the cause is history risk, stop buying the same kind of car.
That's where vehicle intelligence earns its place in the workflow. A dealer who uses provenance data at the acquisition stage reduces the chance of buying units that later turn into explanations, delays, and margin leakage. The result is usually better turnover, and better turnover with fewer surprises.
A disciplined dealership doesn't try to force every vehicle into the same target. It uses the right measure for the right job, keeps stock age visible, and treats provenance as part of the margin equation, not an afterthought.
If you want a clearer way to tie stock turnover rate to vehicle risk, pricing discipline, and smarter acquisition decisions, take a look at AutoProv. It gives UK motor traders trade-focused vehicle history and provenance intelligence that helps spot the stock most likely to sit, stall, or create friction later.
Frequently Asked Questions
AI-Generated Content Notice
This article was created with the assistance of artificial intelligence technology. While we strive for accuracy, the information provided should be considered for general informational purposes only and should not be relied upon as professional automotive, legal, or financial advice. We recommend verifying any information with qualified professionals or official sources before making important decisions. AutoProv accepts no liability for any consequences resulting from the use of this information.
From our AI insights
- UK Part-Exchange Checks: Protecting Dealer Margins
Explore essential part-exchange checks for UK dealers to safeguard profit margins, including provenance and finance verification.
- Why Every Keeper Matters: Insights for UK Car Traders
Understand the importance of checking previous keepers for UK motor trade compliance and risk management.
- Navigating UK Car Auctions: Dealer Insights
Master UK car auctions with these strategic dealer insights and avoid common pitfalls.
Related Articles

Your Ultimate Guide to Buying a Used Car in the UK
Navigate the UK used car market with confidence using our comprehensive buying guide. Tips, checks, and AutoProv Provenance insights included.

Difference Between MOT and Service: What You Need to Know
An MOT is a mandatory legal inspection that every car on UK roads needs to pass.Think of it as the government's way of ensuring your vehicle meets the absolute minimum safety and environmental standards to be considered roadworthy. A service, on the other hand, is a completely different beast. It's the proactive maintenance routine recommended by the people who built your car, designed to keep it running smoothly and catch problems before they start. In short, an MOT is a pass-or-fail exam required by law. A service is a comprehensive health plan for your car.

Your Ultimate Used Car Inspection Checklist
A solid used car inspection checklist is the single most powerful tool you have to avoid buying a lemon. It gives you a methodical way to look past the shiny paint and assess a car's real condition, helping you spot hidden problems and get a fair price before you shake hands on the deal.
Published by AutoProv
Your trusted source for vehicle intelligence