
You can have a vehicle that looks clean on paper, clears a basic vehicle history check UK, and still turns into a headache once it's on your forecourt. The logbook matches, the MOT trail doesn't scream trouble, and the seller sounds plausible, yet the car's actual use tells a different story. That's where telematics data analysis earns its place in the UK motor trade, because provenance isn't just a document trail, it's a usage trail.
Table of Contents
- Why UK Motor Traders Are Turning to Telematics Data Analysis
- What Telematics Data Analysis Actually Means
- How the data flow works
- Key Data Signals Every Dealer Should Understand
- Mileage, route and behaviour signals
- Idle time, fuel and engine signals
- Analytical Methods and KPIs That Matter for Dealers
- What to watch first
- The metrics that move a deal
- Practical Use Cases for UK Motor Traders
- Stock buying and valuation
- Early risk spotting before purchase
- Dealer-owned and courtesy fleets
- Data Quality, Privacy and When Not to Trust the Signal
- What can go wrong
- How to interrogate a dataset
- Connecting Telematics to Vehicle History and Provenance Intelligence
Why UK Motor Traders Are Turning to Telematics Data Analysis
A stock car can look sound on the forecourt and still carry hidden risk. I've seen vehicles that seemed sensible in a basic used car history report, only for the usage pattern to raise questions once the wider signals were pulled together. Traditional checks still matter, but they are snapshots. They do not show how a car was really driven, parked, or worked.
Telematics fills that gap by turning vehicle use into evidence. It can show where a vehicle has been, how it has been used, and whether that usage fits the seller's story. For a dealer, that matters because repeated short hops, abnormal route behaviour, or inconsistent exposure can change how you read the car before you bid, value, or retail it.
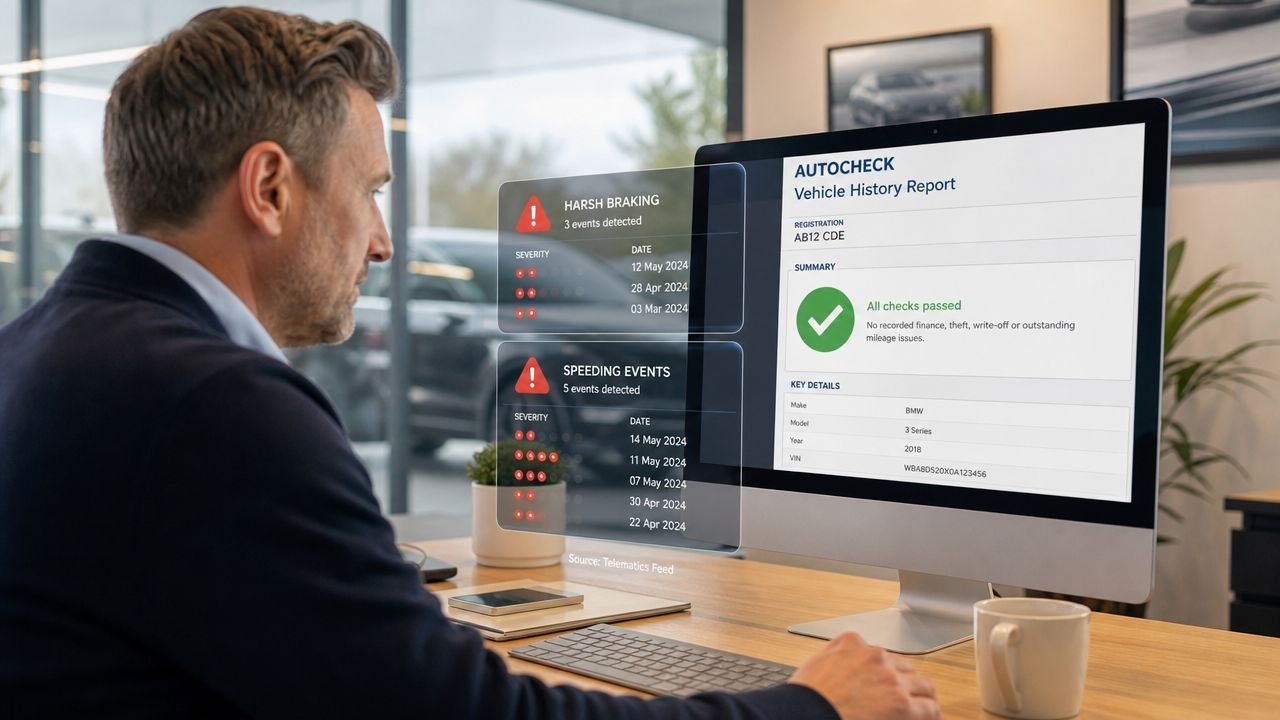
A cleaner way to read it is this. Vehicle provenance is a story, not a single document. The service book, mileage trail, ownership changes, and movement patterns all add different chapters, and telematics often supplies the most revealing chapter because it shows how the vehicle was used. That helps a buyer separate a car that is merely documented from one that is properly understood.
For a useful primer on the wider intelligence layer, see real-time intelligence in vehicle decision-making. That is the shift many dealers need. You are not buying data for the sake of it, you are buying context that can stop a poor unit entering stock.
Practical rule: if the vehicle history check UK gives you a clean headline but the usage story feels incomplete, treat the car as unfinished evidence, not a finished decision.
What Telematics Data Analysis Actually Means
Telematics data analysis starts with movement data, then layers in vehicle health and driver behaviour. A typical device or embedded system captures GPS location, while on-board diagnostics add speed, fuel use, engine signals, and other operating information before the data is transmitted to cloud software for review (Geotab's explanation of telematics). That's why telematics is more than tracking, it's a combined picture of where a vehicle went and how it was treated on the way.
For a dealer, the distinction matters. A mileage check UK can tell you what's been recorded, but telematics can show how that mileage accumulated. Regular long-distance motorway use, repeated stop-start urban work, and fragmented usage all affect condition differently, even when the odometer figure is the same. A car that covered its miles steadily is not the same risk as one that collected them in a scatter of short, harsh journeys.
How the data flow works
A workable model is simple. The vehicle generates signals. The signals go to a platform. The platform aggregates the data. An analyst then queries the pattern, looking for anomalies, exposure trends, or route behaviour that doesn't fit the seller's story.
In practice, that could mean a van that appears lightly used on paper but shows dense local activity, long idle periods, and irregular operating hours. It could also mean a saloon that has the right mileage but a pattern of usage that doesn't match private ownership expectations. That's the key trade distinction, telematics tells you about how the car lived, while a vehicle history check UK tells you about what the record says happened.
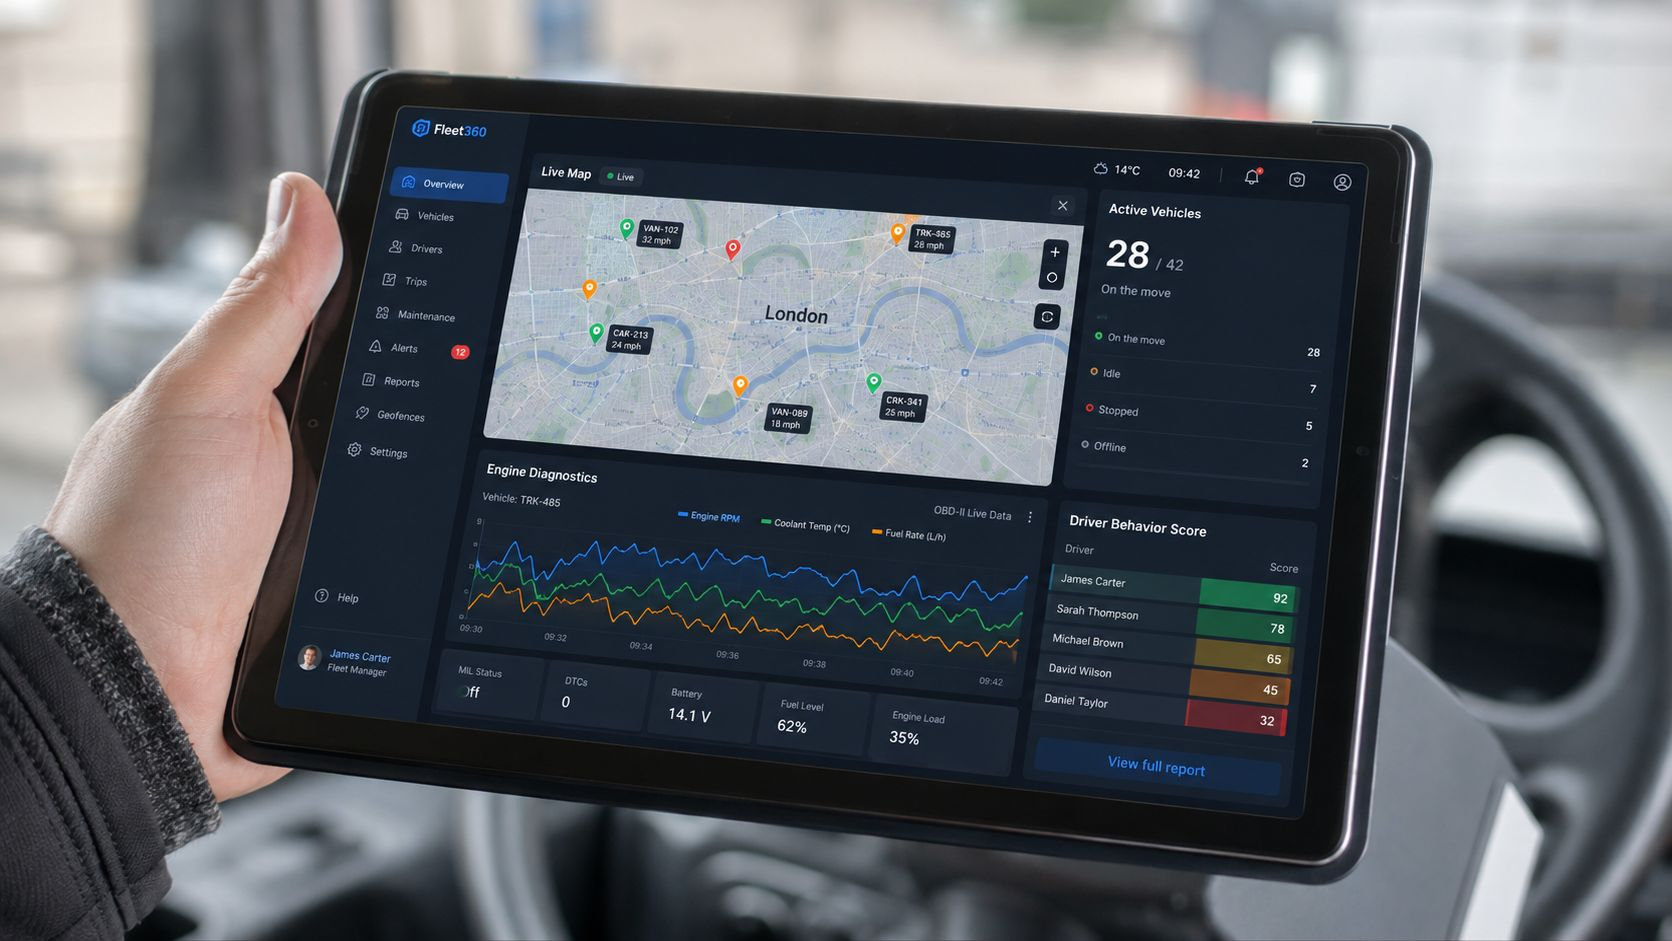
The point is not to replace conventional provenance checks. It's to separate vehicles that are merely documented from vehicles that are fully understood. For a deeper look at how datasets combine, the article on automotive data analytics is a useful companion read.
Telematics earns its value when it becomes evidence you can compare against the seller's story, not just another dashboard to admire.
Key Data Signals Every Dealer Should Understand
The best telematics reviews start with a small set of signals and treat everything else as secondary. Dealers do not need a wall of metrics. They need the handful that show whether a vehicle's life matches the story being sold. The practical task is to tie each signal back to a trade question, then decide whether it supports the asking price, calls for a reduction, or justifies walking away.
Mileage, route and behaviour signals
Mileage patterns are the first place to look because they are the easiest to compare with the story you have been told. Continuous telematics mileage can expose inconsistency more clearly than a single odometer reading, especially if the vehicle looks too fresh for its claimed use or too tired for the mileage shown. That is where a mileage check UK becomes more than a record check, it becomes a pattern check.
Route and geography matter just as much. UK telematics research has shown that urban driving can be broken into distinct usage patterns, with speeds that sit well below lab-style assumptions. The trade point is simple, local stop-start use, repeated short hops, and dense city mileage do not behave like steady road work, and that difference affects valuation. A van used for urban drops will age differently from one that spends most of its time on longer routes.
Driver behaviour is the next layer. Speeding, harsh braking, rapid acceleration and repeated anomalies all say something about wear, even if they do not prove damage on their own. A University of Waterloo model using data from more than 28 million trips found that speeding was the only significant driver-behaviour variable linked to crash risk in its model (University of Waterloo study). That is a useful warning against over-weighting every flashy behaviour metric in the dashboard.
Idle time, fuel and engine signals
Idle time tells a different story again. A telematics review reported average daily idle time of 80 minutes per vehicle, with only 16.8% of vehicles meeting an idle-time goal, and fuel economy improvements from 4 MPG to 6 MPG over a year after installation, equivalent to a 27% improvement (telematics driving data review). For trade use, those figures show why excessive idling is not a soft metric. It points to wasted fuel, possible misuse, and a vehicle that may have had a harder working life than the odometer suggests.
Idle time also helps separate private use from working use. A car that spends long periods running while stationary may have been used for waiting, loading, or repeated short-shift work, all of which affect wear in ways the mileage figure can hide. That matters at point of purchase because the same odometer reading can sit on very different mechanical histories.
Telematics Signal Families and Their Trade Relevance Signal Family What It Measures Typical Trade Question Red Flag Pattern Mileage patterns Distance accumulation over time Does the mileage story fit the unit's age and claimed use? Uneven accumulation, gaps, or usage that does not match the seller's description Route and geography Where and how the vehicle moved Does the route profile make sense for private, retail, or fleet use? Repeated abnormal routes, unexpected local clusters, or inconsistent trip geography Driver behaviour Speeding, braking, acceleration Has the vehicle been treated gently or hard? Repeated aggressive events, especially where usage was meant to be light Idle time Time spent stationary with engine running Was the vehicle worked, queued, or misused? Excessive idling relative to the vehicle's role Fuel and engine diagnostics Operating efficiency and health signals Does the vehicle's mechanical profile support the story? Patterns that suggest inefficiency, abnormal wear, or neglected use For a broader view of the underlying data ecosystem, what data sources power professional vehicle checks is useful context. The main lesson is simple. Do not chase every metric. Focus on the signals that show a mismatch between record, use, and condition.
Analytical Methods and KPIs That Matter for Dealers
A dealership analyst looking at telematics on a live stock bid is usually trying to answer a plain question. Does the usage story support the asking price, or does it point to extra risk that the paper file will not show? Telematics complements conventional provenance checks by separating vehicles that are merely documented from those that are genuinely understood. In stock buying terms, that means pulling a small set of decision-grade KPIs out of the raw trip feed, then using each one for the right question. Trip-level review, exposure measurement, behaviour scoring, and route deviation analysis each serve a different purpose, so the analyst has to know which one supports valuation, which one supports risk, and which one is just noise.
What to watch first
Trip-level analysis is usually the cleanest place to start because it shows the shape of use. A vehicle with short, fragmented, mostly local journeys presents a different risk profile from a unit that spent its time on longer, steadier runs. Exposure metrics then add context around that use, including day-of-week patterns, time of day, and how often the vehicle was active.
Behaviour scoring adds another layer, but only if the score is read with restraint. A broad dashboard score can flatter or mislead depending on how the supplier defines the inputs, while a focused signal often says more about real-world treatment. That is why anomaly detection in telematics matters to dealers, it helps spot changes and mismatches that deserve a closer look before money changes hands.
Decision rule: if a metric does not affect the buying price, the acceptance decision, or the risk conversation, it is probably not a KPI you need.
The metrics that move a deal
The most useful KPIs for a dealer are usually the ones that tie directly to valuation and risk. Idle time can expose waste, commercial pressure, or misuse. Daily distance can show whether the vehicle has been doing the kind of work claimed. Route deviation can reveal when the story and the usage pattern do not line up. In trade, those measures are more actionable than broad scores because they support a buying decision, not just a dashboard status.
A useful way to keep the analysis grounded is to ask whether the pattern would change your offer, your reserve, or your willingness to buy at all. If the answer is yes, the metric earns its place. If the answer is no, it is probably background detail.
For fleet and motor-trade operations, it also helps to look at the practical side of how these measures feed management decisions. Bridge Global's fleet software picks are a reminder that the value comes from recognising unexpected change, not just collecting behaviour data.
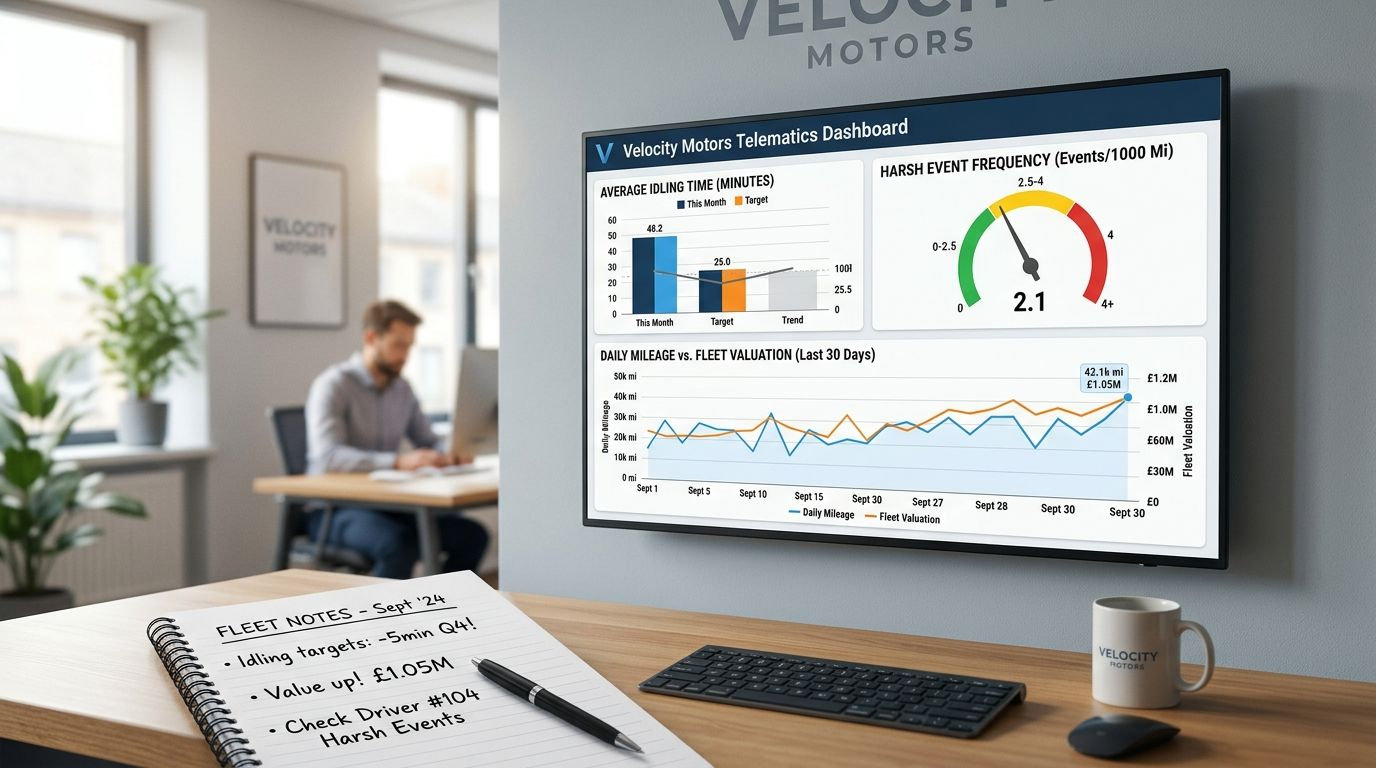
Good analysts do not ask, “What does the dashboard say?” They ask, “What decision does this metric support?” That keeps the buying team focused on risk, pricing, and stock quality instead of analytics theatre.
Practical Use Cases for UK Motor Traders
The strongest telematics use cases are painfully practical. At auction, a unit can look tidy, carry a clean paper trail, and still show signs of heavy local work or inconsistent use. In part-exchange appraisal, the same signals can help separate a well-kept car from one that has been under-recorded. The value is not in predicting perfection, it's in reducing avoidable mistakes before capital is committed.
Stock buying and valuation
On stock acquisition, telematics helps you challenge the seller's narrative early. If the usage pattern suggests frequent stop-start work, repeated high-idle periods, or a geography that doesn't fit the claimed life, the car may still be worth buying, but not at the same number. That gives the buyer a sharper negotiation position and a better reason to walk if the margin isn't there.
For valuation, the benefit is context. A vehicle used in a way that creates heavier mechanical stress may deserve a lower retail confidence level, even if a basic vehicle history check UK looks clean. That matters because provenance isn't just about whether the car has a recorded problem, it's also about whether the pattern of use hints at hidden wear.
Early risk spotting before purchase
Telematics is especially strong as a pre-purchase filter. A trade buyer can use it to spot usage that doesn't fit the seller's description, then ask better questions before the vehicle gets any further. That can mean shorter inspection cycles, cleaner decision-making, and fewer units that need forensic investigation after a purchase has already been made.
Dealer-owned and courtesy fleets
Dealer-owned fleets, courtesy cars, and service loaners benefit too. Pattern review becomes routine asset management rather than one-off due diligence. If you're comparing fleet software for internal operations, Bridge Global's fleet software picks is a reasonable external reference point for the kinds of tools buyers typically evaluate.
A useful workflow is to pair telematics with the rest of your provenance process, then use it as a filter rather than a final verdict. That's the right sequence because no single feed tells the whole story, and the wrong one can create false confidence. I'd rather see a dealer reject one weak unit early than spend a week trying to justify it after the fact.
Data Quality, Privacy and When Not to Trust the Signal
Telematics looks objective, but it isn't immune to bias. Missing trips, short observation windows, smartphone battery drain, opt-in skew, and vendor processing choices can all distort what the dataset seems to say about a vehicle or driver. The UK government's telematics research report makes the broader point clearly, real-world exposure is hard to capture cleanly, and conventional datasets often miss it altogether (UK government telematics research report).
What can go wrong
A smartphone-based feed can undercount activity if the phone isn't charged, carried, or paired consistently. A short sample window can make a vehicle look abnormal when the pattern is seasonal or temporary. Opt-in data can also over-represent certain driver types, which means the sample may not reflect the broader population you think you're analysing.
Caution: if you can't explain how the data was collected, you don't really know what the dashboard is describing.
Privacy matters too. In a commercial setting, the use of telematics-derived signals should follow data minimisation, retention discipline, and a lawful basis for processing. That isn't a legal seminar point, it's a buying discipline point, because sloppy handling weakens trust inside the business and can create avoidable risk outside it.
How to interrogate a dataset
Before you rely on any telematics extract, ask four questions.
- Sample Size: Is the data set large enough to support the conclusion you're drawing?
- Vendor Methodology: Was it collected from embedded hardware, smartphone apps, or a mixed source?
- Missingness Handling: How were missing trips, gaps, and partial journeys treated?
- Reference Validation: Does the extract line up with a trusted dataset or another authoritative record?
The data quality monitoring guide is a useful reminder from a different field that the quality of an insight depends on the quality of the pipeline behind it. That principle applies directly here. If the pipeline is weak, the buying decision is weaker than it looks.
The cautious dealer isn't anti-data. The cautious dealer just wants to know where the data bends, where it breaks, and where it overstates certainty.
Connecting Telematics to Vehicle History and Provenance Intelligence
Telematics analysis works best when it sits beside the rest of the provenance stack. DVLA records, MOT history, mileage records, ownership timelines, and insurance-related events each contribute a different layer of truth, and none of them is complete on its own. That's why a basic check can be useful without being sufficient.
The value of telematics is that it adds the usage layer to the documentary layer. If the route pattern, exposure profile, or mileage behaviour doesn't fit the administrative record, the vehicle deserves a closer look before it becomes stock. For spatial context, types of geospatial data patterns is a good external read on how location data can reveal structure rather than just points on a map.
A provenance report turns those separate signals into a single decision view. That's where the trade benefit appears, not in seeing more data for its own sake, but in seeing the mismatch between records, use, and risk more clearly. The article on provenance check versus comprehensive provenance report is worth reading if you want to sharpen that distinction.
AutoProv fits into that decision layer as a UK-focused provenance and risk-intelligence platform for the motor trade. It brings together the signals dealers need at the point of purchase, so telematics becomes trade intelligence rather than another isolated dataset. When you're buying stock, that context is what helps you price better, question harder, and avoid the vehicles that only look clean until you've already paid for them.
If you're buying, valuing, or wholesaling stock and you want telematics signals put into a proper provenance context, visit AutoProv. It's built to help UK motor traders turn vehicle history, usage patterns, and risk indicators into clearer buying decisions.
Frequently Asked Questions
AI-Generated Content Notice
This article was created with the assistance of artificial intelligence technology. While we strive for accuracy, the information provided should be considered for general informational purposes only and should not be relied upon as professional automotive, legal, or financial advice. We recommend verifying any information with qualified professionals or official sources before making important decisions. AutoProv accepts no liability for any consequences resulting from the use of this information.
From our AI insights
- Navigating UK Grey Imports: A Trader's Guide
Understand the complexities and opportunities of UK grey imports for savvy motor traders.
- Trade Secrets: Identifying Clocked Cars in the UK
Discover how UK traders can spot clocked cars using innovative tools and detailed checks.
- Identifying Ex-Driving School Cars Using MOT Patterns
Learn how to spot ex-driving school vehicles with MOT patterns and history checks.
Related Articles

Essential Vehicle Checks Before Buying a Used Car
Learn essential checks to ensure your used car purchase is safe and sound in the UK market.

Why a Provenance Check is Essential for Used Car Buyers
Ensure your used car is a smart investment by understanding the importance of a provenance check and how AutoProv can help.
A Guide to Vehicle Check with VIN Number
A vehicle check with vin number is easily the most important thing you can do before buying a used car. Think of it as your first line of defence—a quick, simple step that pulls back the curtain on a vehicle's past, protecting you from expensive mistakes, legal headaches, and downright dangerous cars.
Published by AutoProv
Your trusted source for vehicle intelligence