
A vehicle can look like exactly the right buy and still carry a hidden margin problem. In the UK, analysis has reported that 2.1% of secondhand cars have been clocked, equivalent to about 160,000 vehicles sold each year, with estimated annual losses of £750 million for used-car buyers. The same reporting found a 1.9% discrepancy rate among cars under five years old, so newer, faster-turning stock isn't automatically safer. UK mileage-fraud reporting shows why age, model popularity and purchase price can't stand alone as stock selection criteria.
The practical question isn't, “Will this sell?” It's, “Can I verify what I'm buying, price the risk correctly and retail it without avoidable disputes?” That shift puts vehicle provenance, mileage trajectory, ownership behaviour and cross-record anomalies alongside demand, preparation cost and margin. For UK dealers, a good stock decision starts before acquisition, not when the car reaches the forecourt.
Table of Contents
- Why Traditional Stock Selection Criteria Fail Modern Traders
- Demand is only the first filter
- What basic checks miss
- The Structural Reality of Mileage Fraud in the UK
- Why probability changes the buying process
- Make provenance a primary filter
- Reading MOT History as a Risk Timeline
- Start with the earliest available reading
- Ownership Patterns and Rapid Resale Signals
- Read the sequence, not just the total
- Why rapid resale affects margin
- Balancing Market Demand Against Fraud Propensity
- Risk-adjusted stocking matrix
- Turn rate must sit beside risk
- A Practical Scoring Template for Trade Buyers
- Score the evidence before the opportunity
- Set a walk-away rule
- Integrating Provenance Intelligence into Daily Workflows
- Move checks to the decision point
- Use systems to surface patterns
Why Traditional Stock Selection Criteria Fail Modern Traders
Traditional buying rules remain useful, but they're incomplete. Age, body style, colour, specification and price band can help identify likely demand. They can't tell you whether the mileage is credible, whether the vehicle has been passed rapidly between traders, or whether a seemingly attractive purchase carries a provenance issue that will undermine valuation.
A low-mileage example may appear stronger than a higher-mileage equivalent, yet the number itself has little value without a reliable trajectory. A vehicle with consistent MOT readings, supporting service invoices and a coherent ownership sequence can be safer stock than one advertised with fewer miles but unexplained gaps or reversals.
Demand is only the first filter
The UK used-car market is large and active. SMMT reported 1,121,243 petrol used-car transactions in Q2 2025 in its used-car data, while Auto Trader reported an average retail used-car price of £16,780 in June 2026, almost unchanged year on year at -0.1%. Those figures point to a market where demand exists, but where disciplined buying and accurate pricing matter more than broad assumptions about what is popular. SMMT used-car data and Auto Trader market reporting provide useful market context, but neither replaces vehicle-level due diligence.
The risk is easiest to see at the point of purchase. A buyer may approve a car because it sits in a familiar model category, meets an age policy, and appears competitively priced. If a later history review reveals mileage manipulation, identity concerns, or a complicated ownership trail, the original gross margin calculation no longer reflects the actual cost of acquisition.
Practical rule: Treat market demand as an entry condition, not a buying decision.
What basic checks miss
A basic vehicle history check UK search can return valuable information, but raw results need interpretation. A pass or clear status doesn't explain every unusual sequence, and a single mileage reading can't establish whether the odometer story is internally consistent. A used car history report should support a decision, not replace judgement.
Effective dealer vehicle checks therefore ask contextual questions:
- Can the mileage be corroborated? Compare MOT readings with service records, invoices and diagnostic information where available.
- Does ownership make sense? Look for unusually short periods, repeated transfers or timing that conflicts with the vehicle's presentation.
- Is the identity consistent? Check the registration, VIN-related information and record history for anomalies.
- Does the price compensate for risk? A cheap purchase isn't attractive if preparation, negotiation or post-sale exposure absorbs the apparent saving.
The stock controller's job is to reject attractive-looking risk when the evidence doesn't support the price. Margin protection starts with knowing what the vehicle is, where it has been and whether its story holds together.
The Structural Reality of Mileage Fraud in the UK
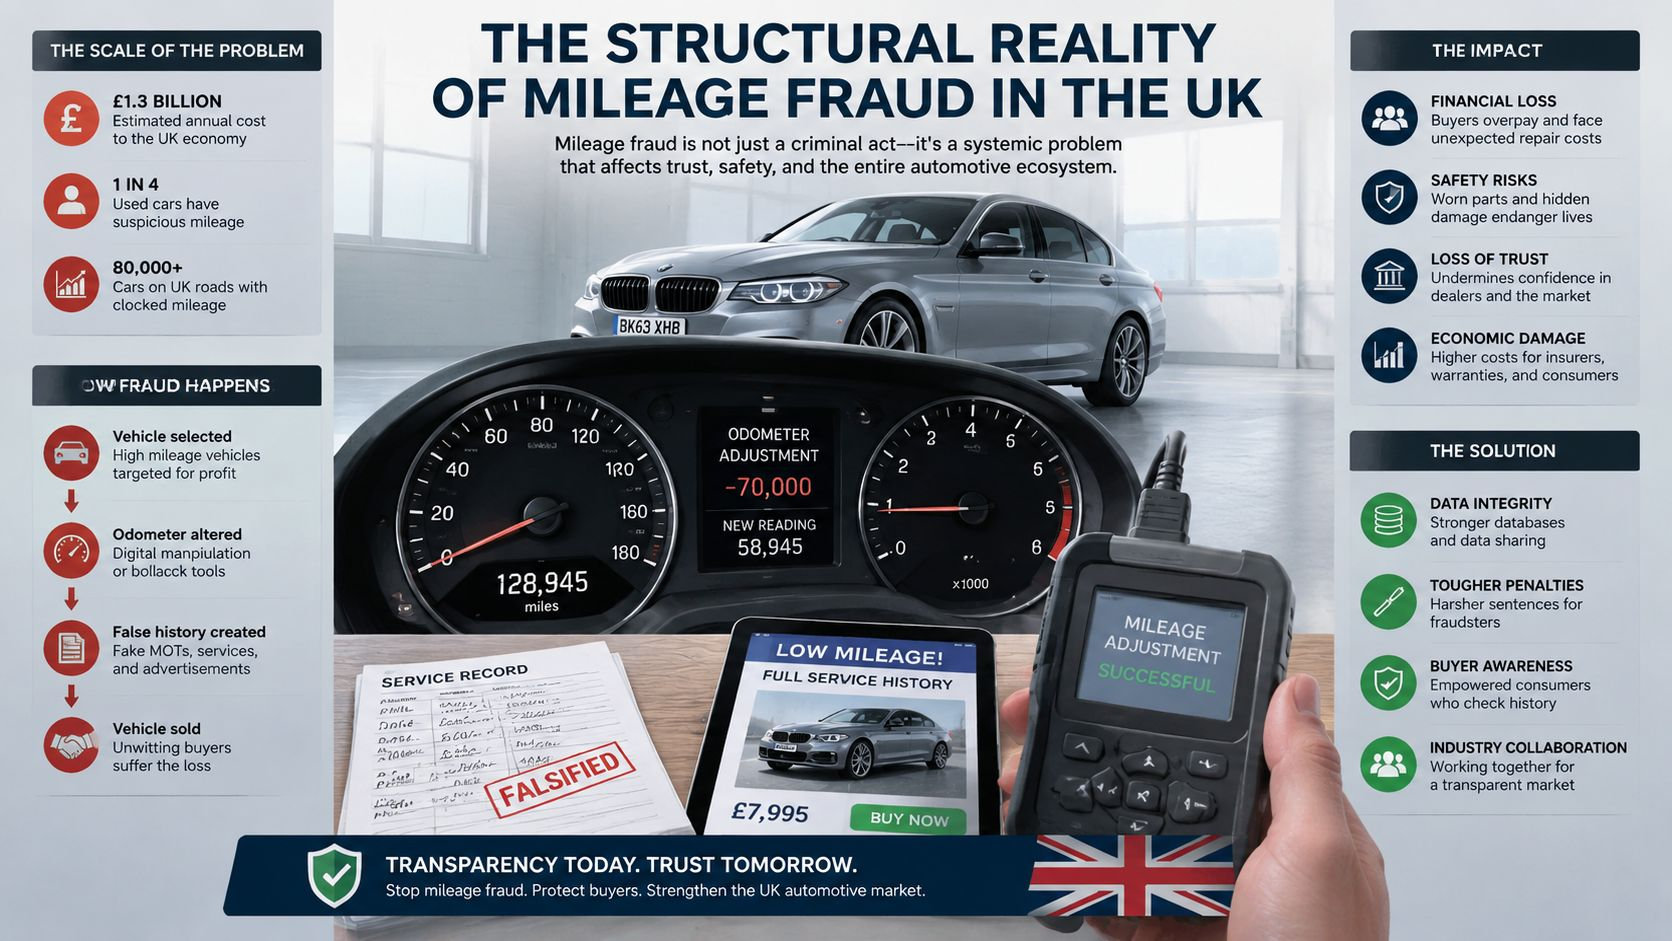
Mileage risk has persisted across the UK market for long enough to influence acquisition policy. HPI reported that one in 20 vehicles had a mileage discrepancy in 2014, moving to one in 16 in 2015 and 2016, then one in 14 in 2018. In 2019, its confirmed mileage-discrepancy hit rate reached 8.99% across 836,214 vehicles, compared with 7.35% in 2018. HPI's historical mileage-fraud reporting shows a persistent structural risk, not an occasional outlier.
Why probability changes the buying process
A trader doesn't need to assume every suspicious vehicle has been clocked. The commercial point is different. When a measurable class of stock carries mileage risk, a workflow that relies on visual condition, seller confidence or luck leaves the business exposed.
A separate analysis of 62.7 million vehicles found 3.42 million, or 5.45%, showed a mileage reduction between MOTs after data anomalies had been removed. That equates to about one in 18 vehicles in the analysed population. The MOT-record analysis supports a straightforward trade response, validate the mileage trend and seek corroborating records before committing capital.
A false mileage reading affects more than advertising copy. It can distort buying price, expected residual value, finance presentation, preparation decisions and the confidence of the next buyer. The vehicle may still be mechanically sound, but the acquisition can become commercially weak once its true history is understood.
Make provenance a primary filter
A proper mileage check UK process should sit near the start of the buying workflow. It shouldn't be a box ticked after the vehicle has already been won. AutoProv's guidance on a fraud detection system reflects the wider need to identify patterns across records rather than treating each data point in isolation.
The practical standard is simple. If the mileage trajectory doesn't make sense, pause the purchase, obtain evidence or walk away. A credible explanation supported by dated documentation may resolve an anomaly. A vague explanation shouldn't be allowed to convert a risk signal into an assumption of safety.
Reading MOT History as a Risk Timeline
A chronological MOT review can expose risk that age, mileage and model popularity hide. The official service lets users see whether each test passed or failed and the mileage recorded at testing, although a registration number is required to search. The official MOT history service provides a useful foundation for a vehicle history check UK workflow, but it records MOT events rather than the vehicle's complete provenance.
Read the entries in date order. The objective is to judge whether the pattern describes believable use, then identify the records that need independent support. For a practical walkthrough, see this guide on how to view MOT history and make smarter buying decisions.
Start with the earliest available reading
Write down every MOT date and mileage before forming a view. A later reading below an earlier one is an immediate anomaly. Small increases, long gaps and sudden jumps need context because mileage trajectory is a risk signal, not a standalone verdict. Independent guidance on reading MOT history explains the basic discrepancy principle, where a later recorded mileage is lower than an earlier reading.
Work through four questions:
- Could this be a recording error? DVSA says an MOT centre can correct an error if it is identified within 28 days. After that, the change must be reported to DVSA with documentary proof. DVSA's correction process helps separate a documented correction from an unexplained alteration.
- Does the usage pattern make sense? Large increases may indicate heavy use. A flat sequence may reflect limited driving, time off the road or missing records. Neither pattern proves fraud.
- Do other records agree? Service invoices, maintenance stamps, repair dates and diagnostic readings can support the MOT sequence or expose a conflict.
- Does the vehicle's condition fit? Steering wheel, pedals, seat bolsters and tyres do not prove clocking, but wear can justify closer scrutiny of the claimed mileage.
The MOT record is a timeline, not a verdict. Use it to decide what requires corroboration.
A gap is a question, not proof of wrongdoing. Storage, export, time off the road or an absent test may explain it. Risk rises when the gap sits beside a later mileage reversal, a rapid ownership change or a sharp change in condition.
Basic checks show events. The buyer must connect those events to timing, ownership and physical evidence. Good trade vehicle intelligence turns that chronology into a reasoned acquisition decision.
Ownership Patterns and Rapid Resale Signals
Ownership history is often treated as a count. Experienced buyers should treat it as behaviour. The number of keepers matters less than how long each keeper retained the vehicle, when the transfers occurred and whether the sequence resembles normal use.
A car that moves rapidly through several hands may be perfectly legitimate. It may also be a vehicle that repeatedly fails to satisfy buyers, gets returned, passes through trade channels or carries a problem that isn't obvious from the advert. The pattern doesn't prove the cause, but it changes the risk premium the buyer should demand.
Read the sequence, not just the total
Short-term ownership becomes more significant when it clusters around other warning signs. For example, a recent transfer followed by a rapid resale, an unexplained mileage change and inconsistent service documentation creates a different buying proposition from a single private owner who retained the vehicle for a substantial period.
Look for:
- Rapid transfers: Several changes close together can indicate trade bouncing or unresolved dissatisfaction.
- Timing conflicts: An ownership change that sits beside a mileage reversal or major record gap requires explanation.
- Repeated resale behaviour: Vehicles that appear to move quickly between sellers may be harder to retail, even if the specification is attractive.
- Evidence quality: A coherent paper trail can reduce uncertainty. Missing or contradictory documentation increases it.
The point isn't to penalise every vehicle with multiple keepers. It's to avoid treating owner count as a positive or negative verdict without context.
Why rapid resale affects margin
A rapid resale signal can influence more than the purchase decision. It may affect how much preparation time the vehicle needs, how confidently a dealer can describe it and how likely the next buyer is to raise questions. If a vehicle returns after sale, the cost includes staff time, diagnosis, transport, negotiation and potential reconditioning, not just the original repair.
That makes ownership duration a useful part of motor trade risk assessment. A trader who ignores the pattern may buy a car at an apparently strong price, only to discover that the previous sellers were transferring uncertainty rather than value.
A focused owner-history check helps frame the question properly. Don't ask only, “How many owners has it had?” Ask, “What does the ownership sequence suggest, and does the price justify the unresolved risk?”
Short ownership isn't a conviction. It's a prompt to investigate.
Balancing Market Demand Against Fraud Propensity
Popularity creates liquidity, but it can also create a larger pool in which manipulation becomes commercially attractive. Recent UK coverage has flagged Nissan Qashqai, Volvo XC60, Volvo XC90, Land Rover Defender and Audi A6 at high rates in mileage-fraud or manipulation reporting. One dataset reported an average rollback figure of 59,201 miles for the Land Rover Defender. The UK model-level mileage-fraud analysis is a reminder that model demand and vehicle integrity must be assessed together.
The right comparison isn't “popular versus unpopular”. It's liquidity adjusted for the probability and cost of hidden risk.
Risk-adjusted stocking matrix
Model Category Retail Demand Fraud Propensity Stocking Recommendation High-demand SUVs with reported model clustering Strong Elevated in relevant datasets Buy selectively, with enhanced provenance and mileage validation Premium SUVs and executive vehicles Can be strong in the right specification Requires close scrutiny where model-level concerns exist Proceed only when records, condition and price align Popular mainstream family cars Generally broad Vehicle-specific, don't infer safety from popularity Use normal screening, then escalate anomalies Lower-demand niche specifications Narrower May vary by vehicle and seller history Buy only with clear exit logic and verified provenance This matrix isn't a substitute for a vehicle-level decision. It prevents a common mistake, allowing a model's retail reputation to override contradictory evidence on the individual car.
Turn rate must sit beside risk
A fast turn can protect holding costs, but it doesn't rescue a poor acquisition. If a vehicle needs prolonged explanation, difficult negotiation or unexpected preparation, its apparent liquidity may disappear. Stock controllers should therefore pair turn expectations with condition, margin, provenance quality and the cost of being wrong.
Use stock turnover guidance to understand how velocity fits into a broader commercial framework, but don't reduce the decision to a single target. A model with good demand may still be unsuitable when its history cannot support the intended retail price.
The useful buying question is:
“What is the expected margin after I price in the evidence gap?”
If the answer depends on a clean history that hasn't been verified, the vehicle isn't ready for approval. Buy the evidence first, or make the uncertainty visible in the price.
A Practical Scoring Template for Trade Buyers
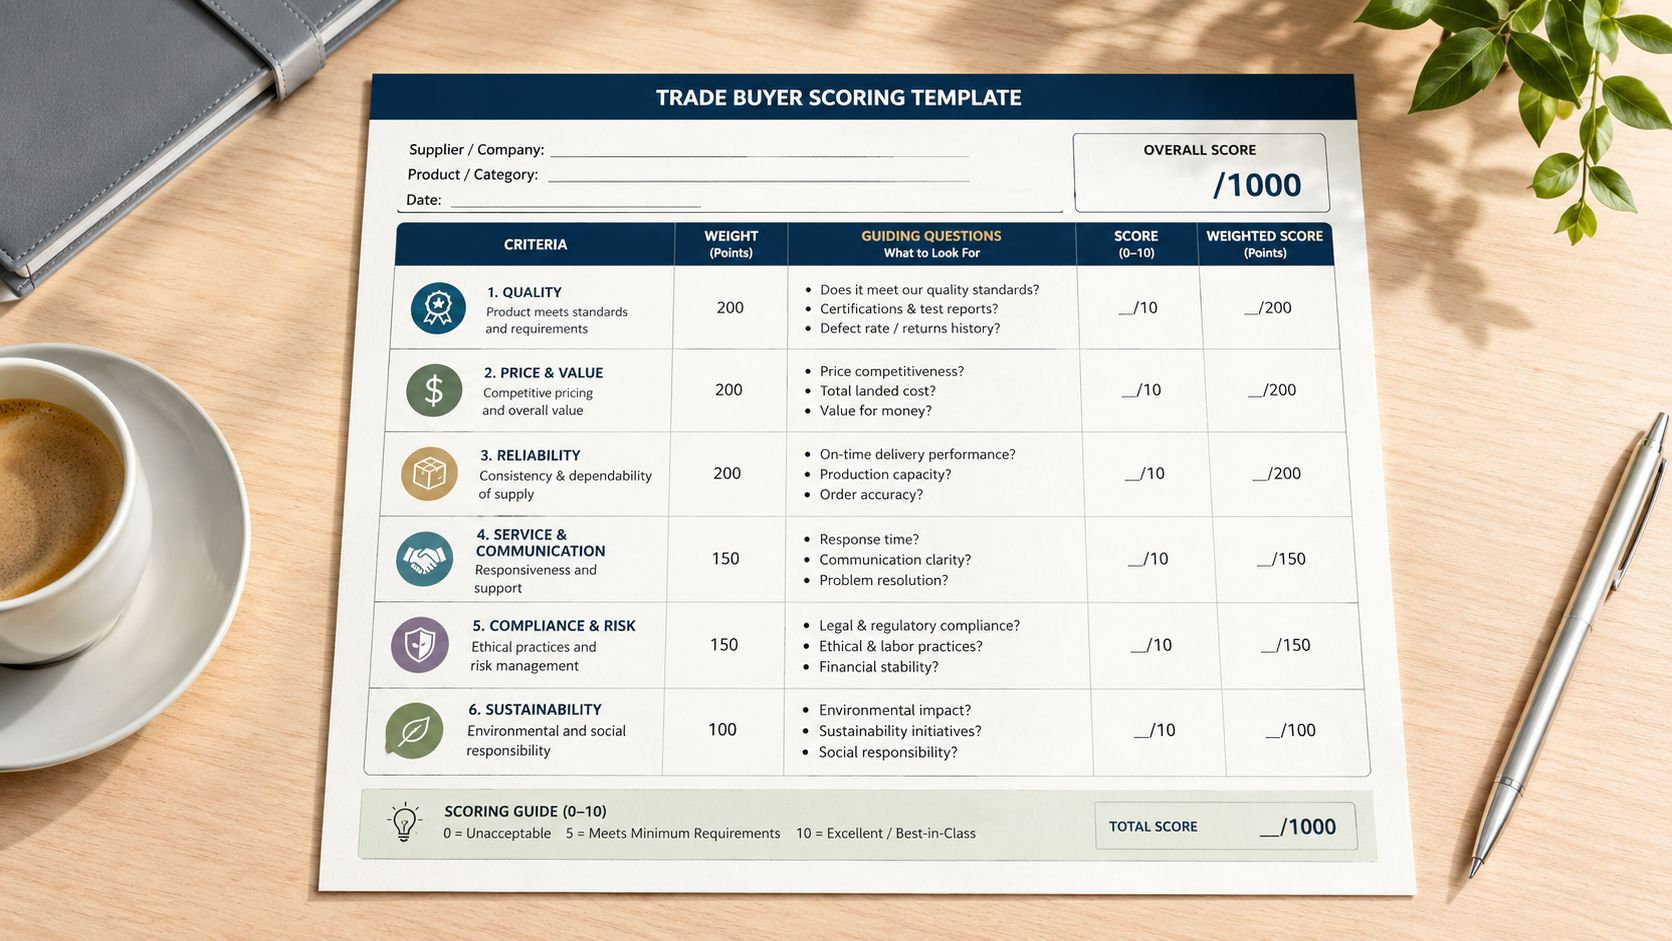
A scoring template is useful because it makes buying standards repeatable. It prevents the most persuasive seller, the busiest auction lane or the most familiar badge from setting the standard on the day. The template doesn't need to be complicated, but every vehicle should pass the same core questions before capital is committed.
Score the evidence before the opportunity
Use a simple scale such as clear, investigate or reject rather than pretending every factor can be measured with false precision. Your business may weight retail demand more heavily than a specialist wholesaler, but provenance should remain a gate. A strong specification shouldn't compensate for an unexplained identity or mileage concern.
Decision area Clear Investigate Reject Mileage trajectory Records progress coherently Minor gap or documentation needed Unexplained reversal or major conflict Ownership sequence Pattern is understandable Short periods need context Repeated rapid transfers with no explanation Identity and provenance Records align One anomaly needs corroboration Material contradiction across records Condition and preparation Costs are understood Inspection required Condition undermines intended margin Demand and exit route Clear retail audience Narrow buyer pool No credible route to sale Price Compensates for known risk Depends on unresolved assumptions Leaves no room for evidence-based risk
Set a walk-away rule
The template works only if the team agrees what happens when a vehicle fails. “Investigate” should mean obtaining a specific document, checking a specific record or arranging a defined inspection. It shouldn't become a holding category for vehicles that buyers feel reluctant to reject.
At the auction or trade park, record the registration, advertised mileage, seller description and any immediate concern. Run the relevant vehicle history check before bidding where possible. If the information isn't available until after purchase, set a maximum bid that reflects the unresolved exposure rather than the vehicle's optimistic retail potential.
Electric vehicles add another preparation consideration. Battery condition, charging behaviour and specialist repair requirements can affect the cost model, so buyers assessing EV stock may also find this practical guide to electric car maintenance costs useful when building their preparation assumptions.
A scoring sheet should make it easier to say no, not provide a reason to rationalise a weak buy.
Integrating Provenance Intelligence into Daily Workflows
A buying process succeeds only when it still works under pressure. Decisions based on memory, individual experience or a last-minute search vary between branches and buyers. Dealers need a repeatable workflow that brings provenance and risk information into the decision while there is still time to negotiate or walk away.
Move checks to the decision point
Set a minimum data set before bidding or agreeing a purchase:
- Vehicle identity: Confirm the registration and relevant VIN information.
- MOT timeline: Review pass, fail and mileage records as one connected sequence.
- Mileage corroboration: Compare the mileage trajectory with service, invoice and diagnostic evidence.
- Ownership behaviour: Examine ownership duration, transfer timing and rapid resale signals.
- Commercial fit: Assess specification, demand, preparation cost and likely exit route.
- Decision status: Mark the vehicle as buy, investigate or walk away, with a recorded reason.
This turns a vehicle history check UK search into a buying control rather than a post-purchase formality. It also creates an audit trail for managers reviewing why a vehicle entered stock and whether the assumptions behind the purchase were reasonable.
Use systems to surface patterns
Human judgement remains necessary, but buyers can miss relationships between records when processing large volumes quickly. A platform that cross-references DVLA information, MOT history, mileage patterns, ownership timelines, insurance-related events and other risk indicators can flag anomalies for review. It does not replace inspection or professional judgement. It focuses attention on the vehicles and issues most likely to affect margin.
AutoProv is one trade-focused option for combining vehicle provenance reports, mileage discrepancy analysis, ownership pattern review and anomaly detection within a UK buying workflow. It provides contextual risk intelligence for dealers and wholesalers instead of presenting isolated history entries. A wider data integration platform approach can connect these checks with internal approval, valuation and compliance routines.
The commercial benefit is consistency. Buyers can apply the same threshold to part exchanges, auction purchases and wholesale stock, while managers can challenge unsupported assumptions before they become inventory. Better intelligence cannot remove every vehicle risk, but it can expose risk early enough to price it, investigate it or reject the purchase.
Apply stock selection criteria as a risk-adjusted framework. Start with market demand, then test mileage trajectory, ownership behaviour, vehicle identity and provenance before approving the price. The decision should reflect both the likely exit route and the evidence behind the vehicle's history. A popular model with an attractive price can still be a poor buy if forensic anomalies leave preparation cost or resale risk unresolved.
Frequently Asked Questions
AI-Generated Content Notice
This article was created with the assistance of artificial intelligence technology. While we strive for accuracy, the information provided should be considered for general informational purposes only and should not be relied upon as professional automotive, legal, or financial advice. We recommend verifying any information with qualified professionals or official sources before making important decisions. AutoProv accepts no liability for any consequences resulting from the use of this information.
From our AI insights
- Auction Pitfalls: Avoiding Costly Mistakes
Navigate UK car auctions with confidence by avoiding finance, write-off, and mileage risks.
- Mastering Paint Code Checks: Detecting Hidden Car Repairs
Discover how to use paint code verification to identify hidden car repairs and ensure a smarter purchase.
- UK Part-Exchange Checks: Protecting Dealer Margins
Explore essential part-exchange checks for UK dealers to safeguard profit margins, including provenance and finance verification.
Related Articles

Your Ultimate Guide to Buying a Used Car in the UK
Navigate the UK used car market with confidence using our comprehensive buying guide. Tips, checks, and AutoProv Provenance insights included.

Difference Between MOT and Service: What You Need to Know
An MOT is a mandatory legal inspection that every car on UK roads needs to pass.Think of it as the government's way of ensuring your vehicle meets the absolute minimum safety and environmental standards to be considered roadworthy. A service, on the other hand, is a completely different beast. It's the proactive maintenance routine recommended by the people who built your car, designed to keep it running smoothly and catch problems before they start. In short, an MOT is a pass-or-fail exam required by law. A service is a comprehensive health plan for your car.

Your Ultimate Used Car Inspection Checklist
A solid used car inspection checklist is the single most powerful tool you have to avoid buying a lemon. It gives you a methodical way to look past the shiny paint and assess a car's real condition, helping you spot hidden problems and get a fair price before you shake hands on the deal.
Published by AutoProv
Your trusted source for vehicle intelligence